How to Calculate the ROI of Contact Center Analytics (And Actually Prove It)
The Measurement Problem
Calculating ROI for contact center analytics is not as simple as comparing before-and-after costs.
Traditional ROI formulas work well for hardware or licenses. Analytics is different. Its value shows up indirectly: in better decisions, earlier problem detection, and issues that never become crises. There is rarely a clean dollar figure tied directly to a specific dashboard.
Here is a common example. A dashboard flags a staffing imbalance. That leads to a schedule change, which cuts overtime, which improves retention. How much credit belongs to the dashboard? It is genuinely hard to say.
The problem compounds when improvements come from multiple sources at once. Handle times improve. Was it the new training? The updated scripts? Or the fact that supervisors could finally see performance trends in real time? Usually all three. Separating each effect is nearly impossible.
There is also a timing gap. The insight happens in month two. The operational improvement shows up in month five. By then, no one remembers the original connection.
A Better Way to Measure Contact Center Analytics ROI
Stop forcing analytics into a traditional cost-savings formula. Measure what actually matters: the decisions analytics made possible.
Measure Decisions, Not Reports
The right question is not “How many dashboards did we build?” It is: “What did we decide differently because we had data we did not have before?”
Keep a running log of moments when analytics changed a decision. Over time, that list becomes your ROI story.
Track Time-to-Insight
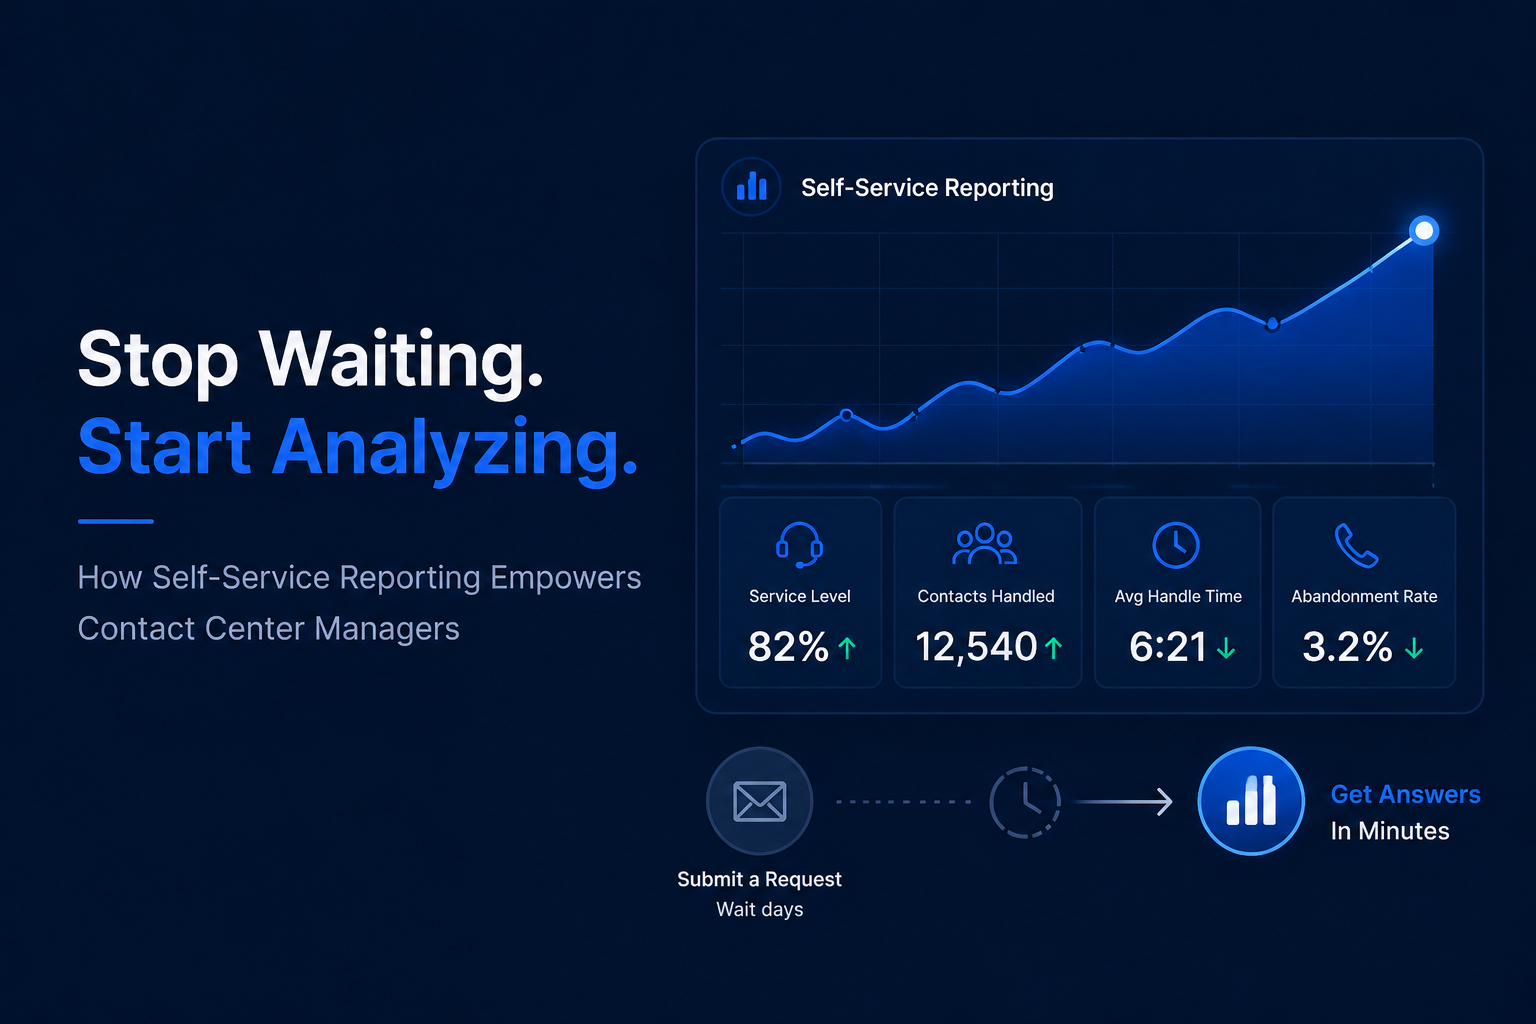
Before robust analytics, a typical workflow looks like this: a supervisor notices a dip in service level, submits an IT request, waits for a report, then starts investigating. Days pass.
With self-service analytics, that same supervisor drills into the issue directly and finds the root cause in minutes.
That gap, from days to minutes, is measurable. Multiply it across dozens of decisions each month, and the operational impact becomes hard to ignore.
Connect Discoveries to Actions
When you uncover a trend, like a spike in handle time on Tuesdays or a pattern in escalations, document what you did next and whether it worked. Over time, this builds a portfolio of analytics-enabled wins you can reference when anyone asks about ROI.
Correlate Adoption with Outcomes
Are the teams using analytics most frequently also the teams with the strongest KPIs? You may not be able to claim direct causation, but correlation is a credible signal. If your highest-performing supervisors are also your heaviest analytics users, that is a story worth telling in any budget conversation.
Quantify Avoided Costs
Some of the highest-value ROI comes from problems that never happened. The staffing shortfall you caught before it became a service level crisis. The training gap you identified before it became turnover. These are real savings, even when they feel hypothetical.
The key is documenting the near-miss when it happens, not trying to reconstruct it three months later.
Where Contact Center Analytics ROI Calculations Go Wrong
Counting Outputs Instead of Outcomes
“We built 15 dashboards this quarter” sounds productive. But dashboards no one uses deliver zero ROI. Measure usage and impact, not volume.
Over-Attributing Improvements
If service levels improved 10 percent, analytics did not do all of that alone. Be honest about the contribution. “Analytics contributed to improvements that collectively saved $200,000” is more credible than taking full credit. Credibility matters when you need budget approved next year.
Ignoring Soft Benefits
Supervisor confidence, faster escalation resolution, fewer gut-feel decisions. These are real advantages even when they resist easy quantification. Do not dismiss them because they do not fit a spreadsheet.
Waiting Too Long to Document
An analytics win feels obvious in the moment. Three months later, the chain of events blurs. Build a habit of logging decisions, actions, and outcomes as they happen, in a shared doc, a Slack channel, wherever your team actually works. That record pays off when the ROI question comes around.
Frequently Asked Questions About Contact Center Analytics ROI
What is a realistic ROI timeline for contact center analytics? Most teams start seeing measurable operational impact within 60 to 90 days of consistent use. Full ROI stories with documented wins typically take 6 to 12 months to build.
What metrics matter most for proving analytics ROI? Time-to-insight, supervisor adoption rate, decisions changed by data, and correlation between analytics usage and KPI performance are the most useful signals.
How do you calculate avoided costs in analytics ROI? Document near-misses in real time. When analytics flags a problem before it escalates, record the risk, the action taken, and the estimated cost of inaction. Even rough estimates carry weight.
Can small contact centers benefit from analytics ROI tracking? Yes. Smaller teams often see faster correlation between analytics adoption and performance because the feedback loop is shorter and attribution is cleaner.
The Bottom Line
The ROI of contact center analytics is not in the data itself. It is in the decisions you could not have made without it.
Stop chasing a single number. Build a portfolio of moments where visibility changed behavior, specific decisions, specific actions, specific outcomes. That case makes itself.
None of it works, though, if people are not using the tools. If getting an answer requires an IT ticket and a two-week wait, most questions never get asked. And there is no ROI to measure.
Tools like Brightmetrics make self-service access practical. Managers drill into any metric without waiting. That turns analytics from a reporting function into a decision-making habit, and habits compound value over time.