You Can See What Is Happening. You Cannot Tell If It Is Normal.
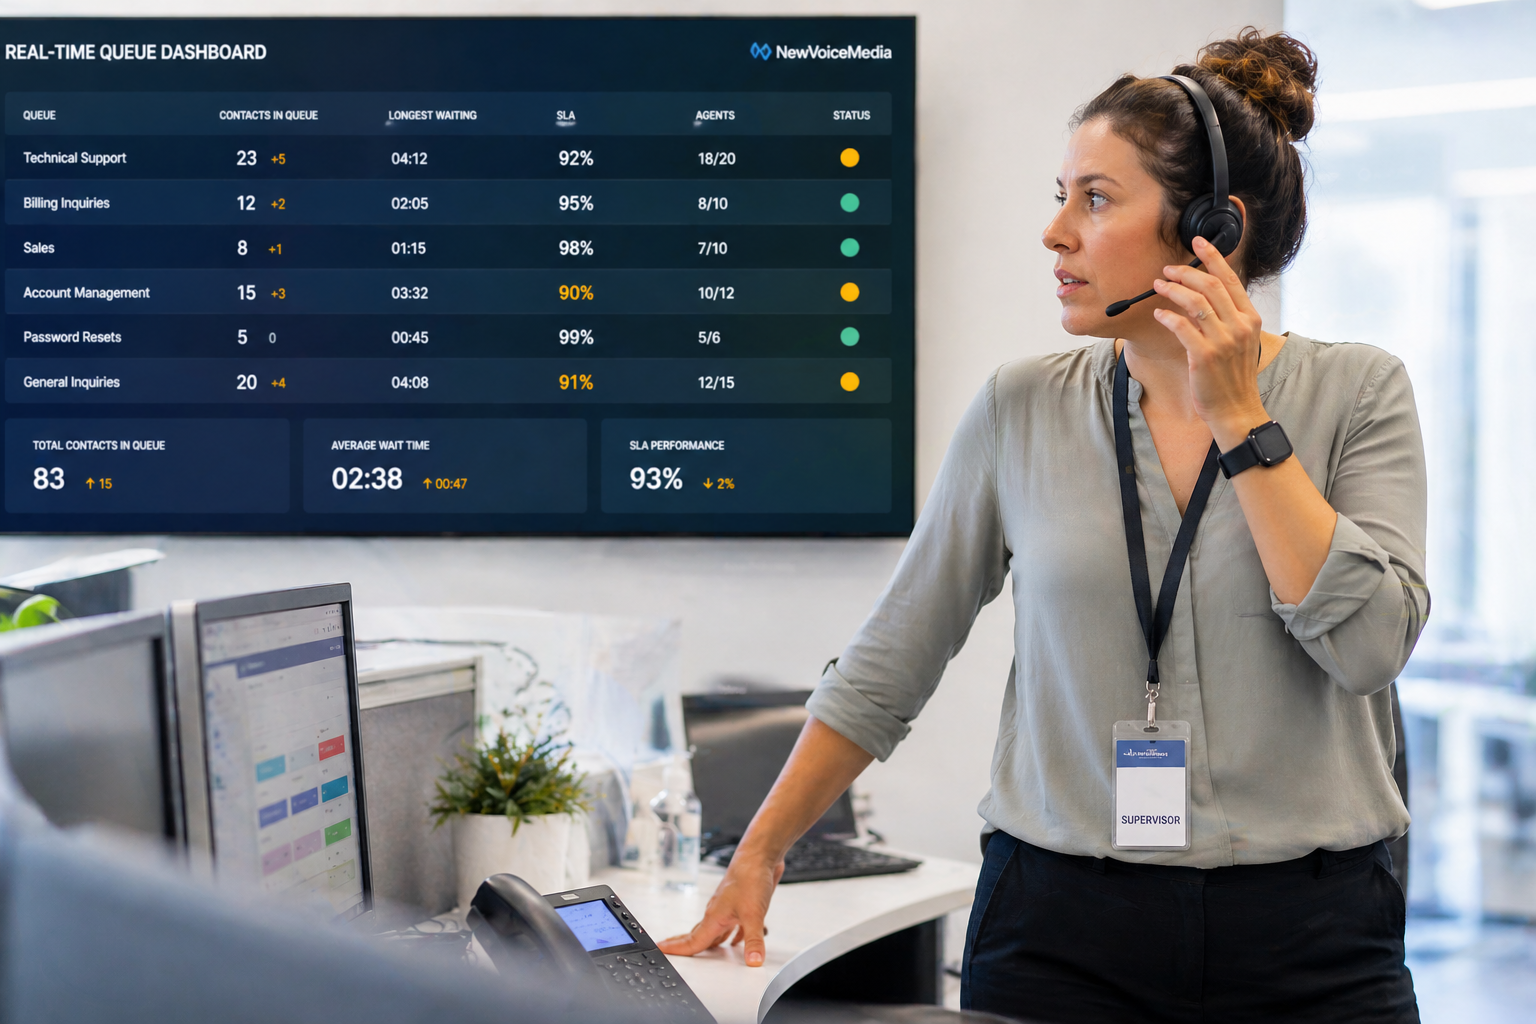
The live dashboard shows a metric moving. Service level dipping. Abandonment climbing. You can see it happening in real time.
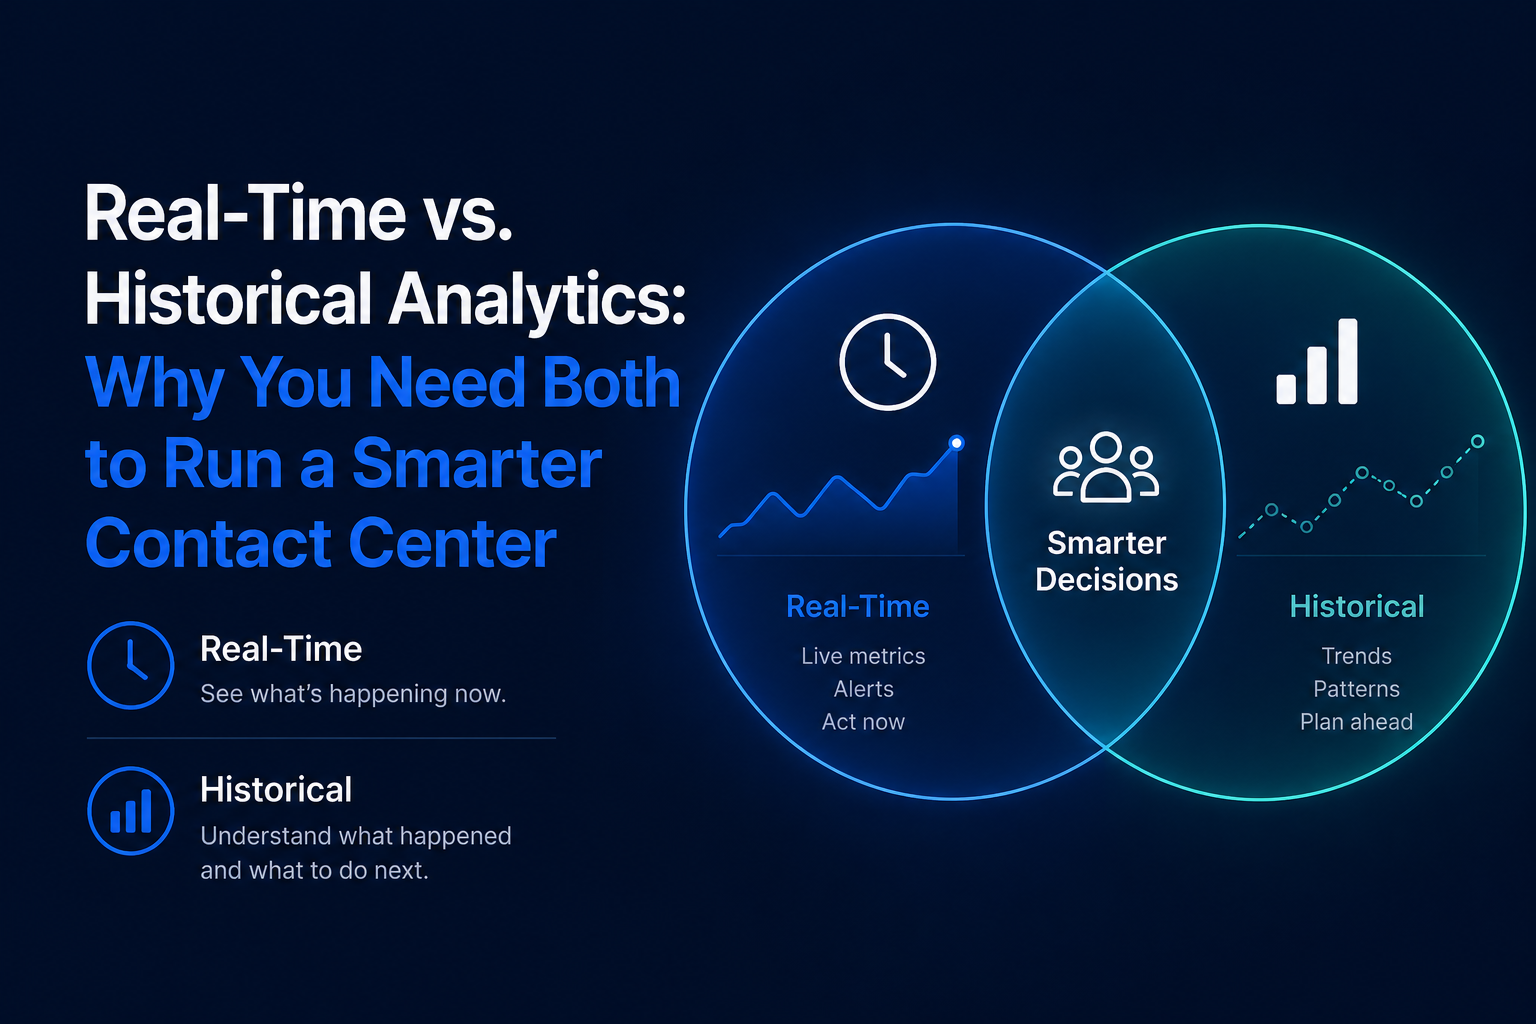
What you cannot see is whether this is a blip or a trend. Whether this happened last Tuesday too. Whether it always happens at this hour on this day of the week, or whether today is genuinely unusual.
Without that context, you are managing the moment without understanding it. Real-time visibility tells you what is happening. Historical analytics tells you whether it matters, what caused it, and what to do about it.
Most contact centers invest heavily in the first and underinvest in the second.
Why Most Operations Underuse Historical Data
The gap is almost never about whether the data exists. Your contact center platform captures historical data. The gap is about whether you can access it when you need it, in the format you need it, without a significant effort to get there.
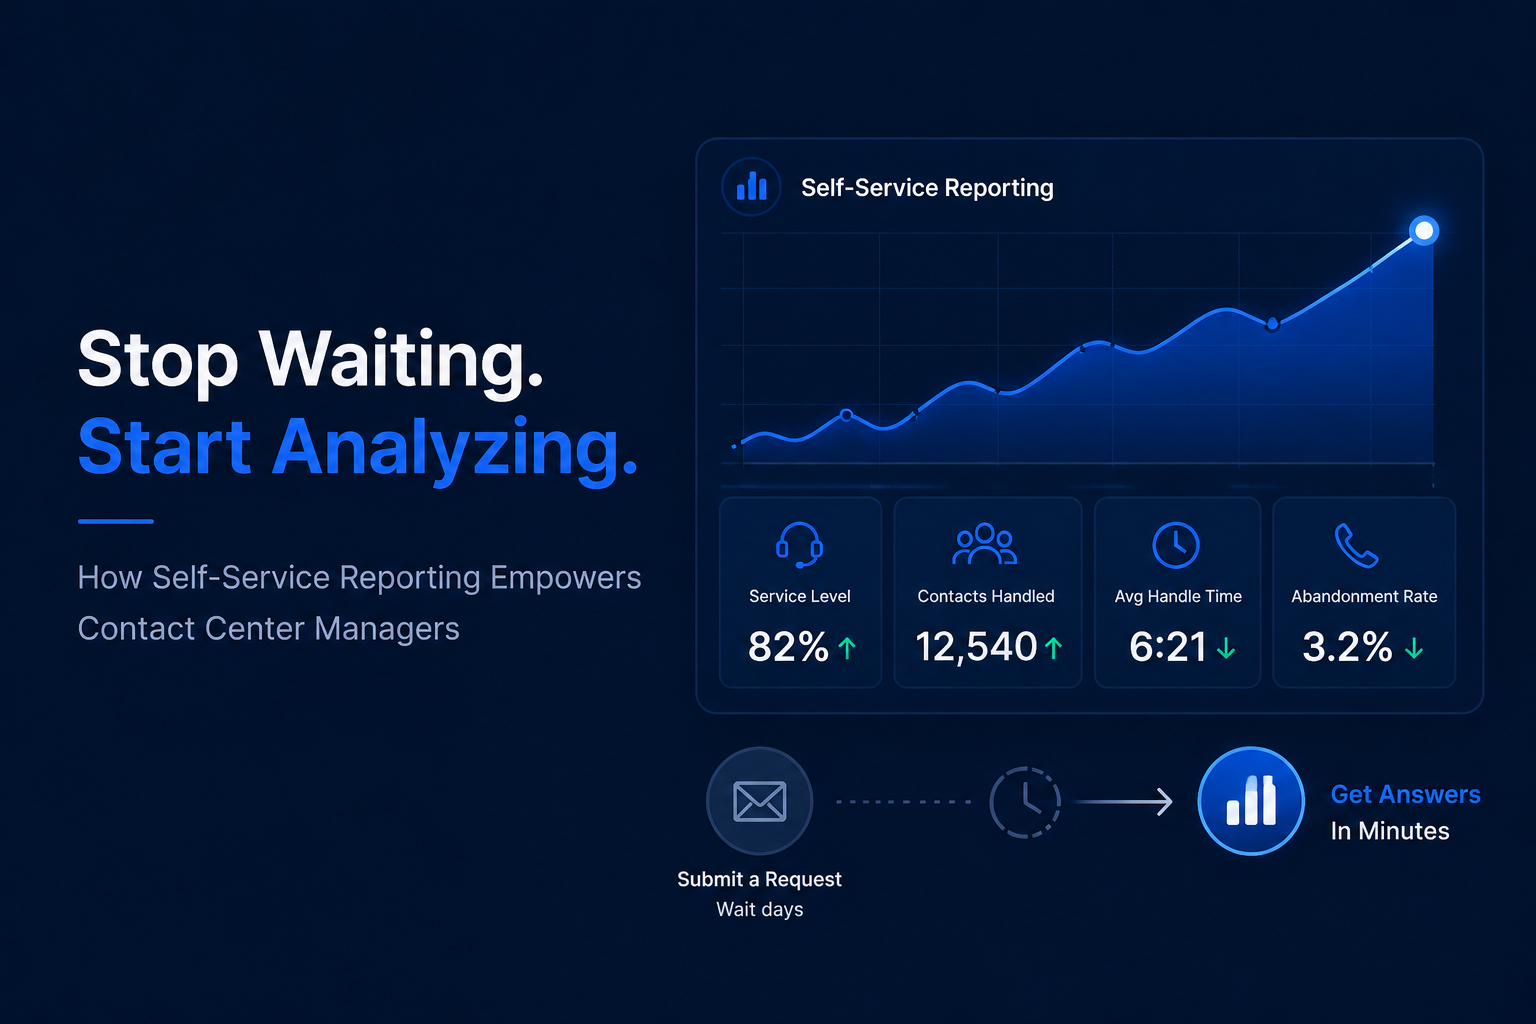
When accessing historical data means submitting a request, waiting for a report, getting back a spreadsheet, and then building your own analysis, most of the questions that historical data could answer never get asked. The operational value of that data sits unused.
The goal is not more historical data. It is faster, easier access to the historical data that already exists.
What Historical Analytics Actually Enables
Pattern Recognition
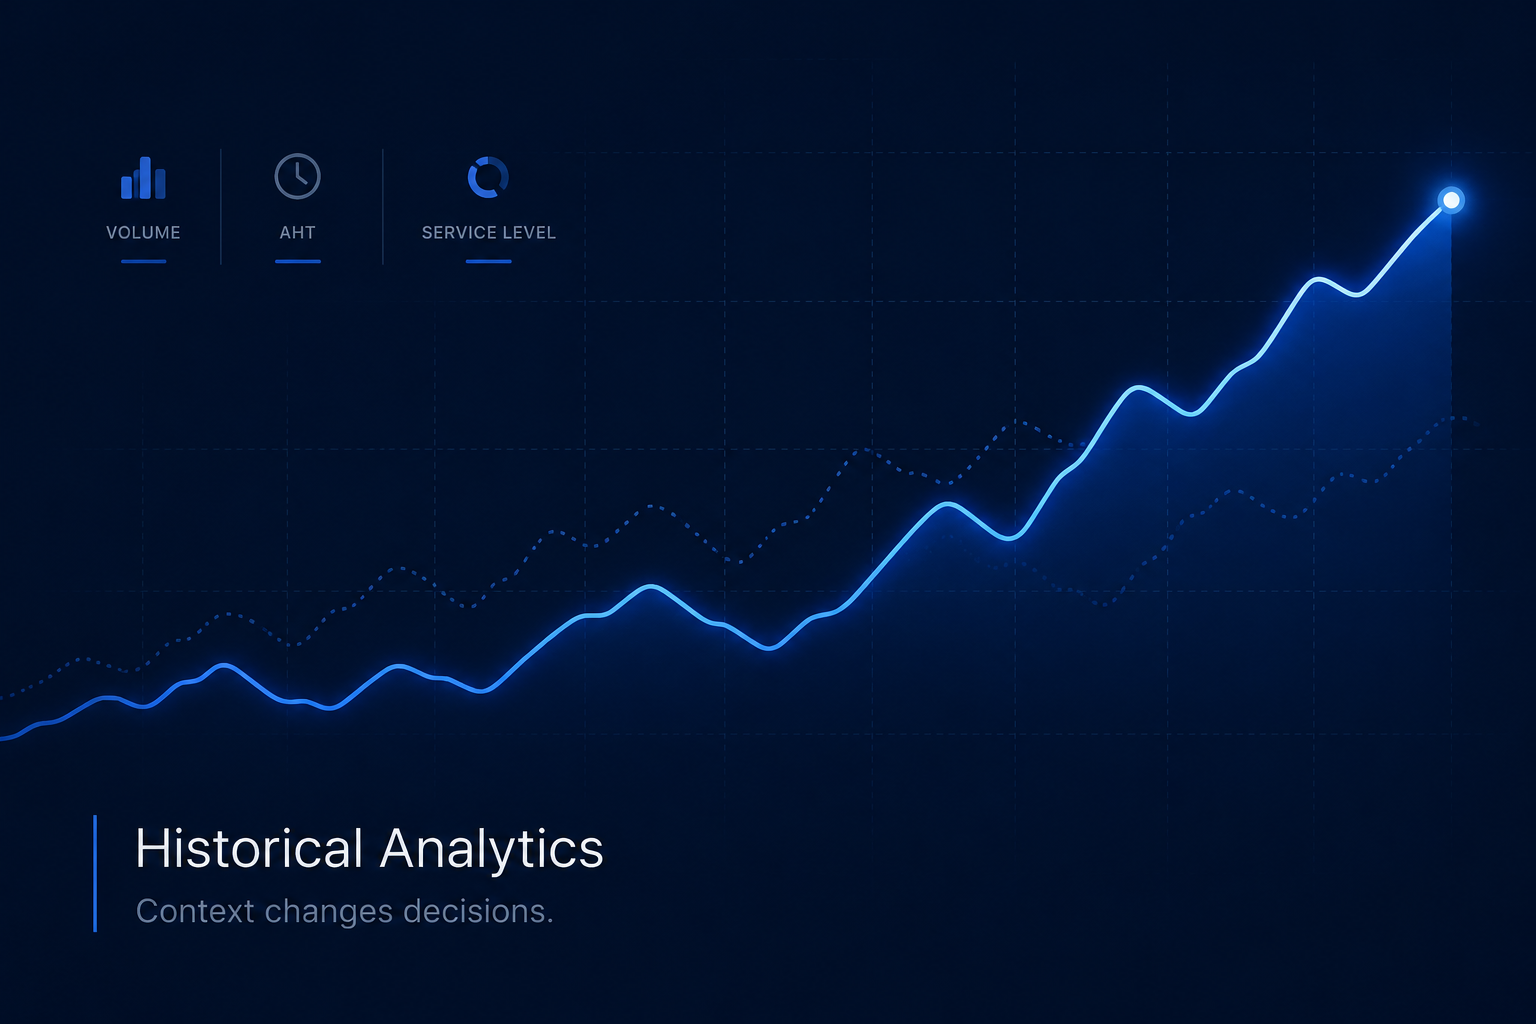
When you can see data across weeks and months, patterns become visible that are invisible in a single day’s view. Volume is consistently higher on Mondays. Handle time spikes in the last week of the month. Abandonment climbs every year in the two weeks before a major holiday.
These patterns exist whether you can see them or not. The question is whether you are planning around them or being surprised by them. The operations that get staffing right before a peak are not lucky. They looked at the data.
Root Cause Investigation
Something changes today. Service level drops. Handle time spikes. Real-time tools tell you it is happening. Historical data tells you whether it happened before, when it happened, what else was happening at the same time, and what changed after it was addressed.
Without historical context, you are diagnosing a problem with no medical history. You might guess right. You will diagnose faster and more accurately with the full picture. And without the full picture, the same problem often recurs because the root cause was never actually identified.
Performance Benchmarking
What is normal for your operation? Not industry benchmarks. Your operation, your queues, your call types, your agents. Historical data establishes your baseline so you can tell the difference between a normal Tuesday and a Tuesday with a problem. Without your own baseline, you are comparing against standards that may not apply to your operation at all.
Strategic Planning Support
Staffing decisions, budget requests, capacity planning, and technology evaluations all benefit from historical data. A manager making a staffing case to leadership with six months of trend data is in a fundamentally different position than one making the same case from gut feel and a one-week snapshot. One is a negotiation. The other is a presentation of evidence.
What to Watch Out For
The most common historical analytics mistake is using industry benchmarks as a proxy for your own baseline. Your operation’s normal is specific to your call types, your customer population, and your staffing model. Someone else’s benchmark may not apply.
A second trap is treating one week of data as a trend. A metric that looks bad for seven days might be seasonal, might be tied to a specific event, or might be a genuine problem. You cannot tell without more history.
A third mistake is pulling historical reports only when something has already gone wrong. The value of historical analytics is in catching patterns before they create problems, not in reconstructing what happened after the fact.
What Good Historical Access Looks Like
You should be able to answer questions like these without submitting a request or opening a spreadsheet:
How did service level trend over the last 90 days? What was handle time in the billing queue for the last six Mondays? How does this week’s abandonment rate compare to the same week last year? Which queue has shown the most performance improvement over the past quarter?
Those are not complex analytical questions. They are operational questions managers ask regularly. When the answer takes minutes instead of days, historical analytics becomes a daily tool rather than an occasional project.
Frequently Asked Questions
What is contact center historical analytics? Historical analytics refers to the analysis of past performance data to identify trends, understand patterns, investigate root causes, and inform planning decisions. It is distinct from real-time monitoring, which shows current operational status.
How far back should contact center historical data go? For most operational purposes, 12 to 18 months of accessible historical data covers seasonal patterns and year-over-year comparisons. Compliance and regulatory requirements may dictate longer retention periods.
Do you need a data analyst to use historical analytics? Not with the right tool. Brightmetrics is designed for non-technical users, meaning contact center managers can pull historical trend data, build custom time period comparisons, and drill into specific queues or call types without writing queries or waiting on an analyst.
How is historical analytics different from standard reporting? Standard reports show a fixed view of a fixed time period. Historical analytics lets you explore data across any time range, compare periods, identify trends, and drill into the details that explain what you are seeing. The difference is flexibility and depth.
The Bottom Line
Real-time visibility is essential. But the decisions that most affect your operation, staffing, coaching, planning, and budgeting, are informed by history more than by the current moment.
The organizations that use historical data well are not doing something exotic. They are just asking and answering questions that other organizations are leaving unanswered because the data is too hard to reach.
Brightmetrics connects to your existing Genesys Cloud, Mitel, or RingCentral platform and makes historical data accessible to the managers who need it, without a data team, without a ticket, and without a week of waiting.