Recent research highlights a significant challenge for data professionals: an average monthly increase in data volume by 63%. This surge underscores the need for effective management and utilization of vast amounts of data, particularly in contact centers.
By analyzing, understanding, and optimizing this ever-growing data, businesses can gain valuable insights into their operations. These insights are crucial for making informed decisions about high call volumes, long wait times, and agent performance.
This blog delves into the process of transforming your contact center data into actionable strategies, demonstrating how advanced analytics can significantly transform and simplify decision-making processes.
Analyzing Contact Center Data
Analyzing contact center data begins with extracting datasets from various systems in your organization, such as cloud-based software tools like RingCentral or CX platforms like Genesys Cloud. This engagement data can then be sliced-and-diced with a robust analytics tool, simplifying the comparison and identification of patterns and trends.
With data in the right place, it’s possible to discover valuable insights, such as the duration of calls handled by agents or the average call volume within a specific timeframe. Key Performance Indicators (KPIs) play a vital role in this stage.
By tracking KPIs like Average Handling Time (AHT), Abandonment Rate, First Call Resolution (FCR), Transfer Rate, and Service Level, you can gauge the efficiency and effectiveness of your center. Selecting the most relevant KPIs for your needs and monitoring them over time is essential for generating meaningful data insights.

Understanding Your Contact Center Data
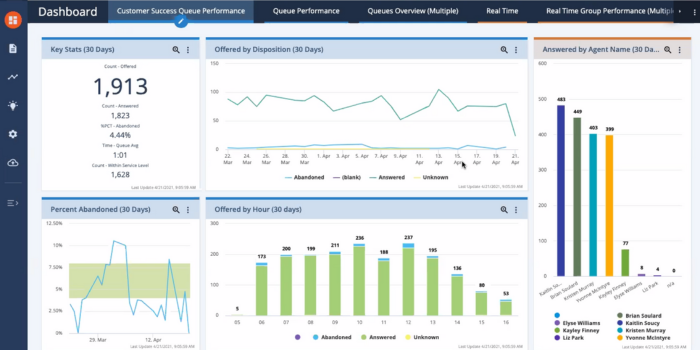
Extracting data sets from contact center systems is not enough to unlock the insights needed for improving operations. A robust data analytics tool is essential for interpreting patterns and trends in your data. The most effective data analytics tools go beyond basic reporting; they utilize dashboards, charts, graphs, real-time data, and other visualizations to make data more accessible and understandable.
For instance, if you aim to analyze the Average Handling Time by different agents, an analytics tool can display this information in a simple bar chart format. Such visual representations enable quick identification of which agents are most efficient in handling calls. This approach to data visualization not only simplifies the understanding of complex data sets but also saves considerable time and effort compared to traditional methods like manual spreadsheet analysis.

These tools also streamline sharing insights. Visualizations can be easily shared with team members, including call center supervisors and team leaders, facilitating collaborative decision-making on optimizing data practices. The ability to produce and disseminate comprehensive reports quickly enhances team communication and efficiency in addressing data-driven challenges.
Linking Data Insights to Decision-Making
Once you have deciphered your contact center data, the next step is optimization, which is intrinsically linked to making informed decisions. This stage involves not only interpreting the data but also applying these insights in a practical context to improve business operations.
For example, if analysis indicates high Average Handling Time, decision-makers might implement targeted agent training or revise call scripts to boost efficiency. Patterns in call volumes could lead to more optimized staffing, enhancing customer satisfaction and reducing wait times. This process of linking data insights directly to decision-making ensures that strategies are both data-informed and practically geared towards achieving specific business goals.
Actions may also include rewarding the most efficient agents, providing additional training for those needing improvement, and revising existing operational policies. This is where strategic decisions are translated into tangible actions, based on the insights provided by data analytics.
Key areas of optimization include:
- Investing in new technologies to enhance efficiency if current systems are found lacking.
- Developing and enforcing new policies in the contact center, guided by data-driven insights.
- Streamlining workflows to remove bottlenecks in business operations.
- Enhancing customer experiences by understanding and addressing their expectations.
Optimization is the linchpin of the data analysis process, directly affecting the performance, productivity, and profitability of your center. It represents the transformative step where data transcends from being mere numbers on a screen to actionable insights that drive meaningful change in your contact center operations. This stage is critical as it embodies the practical application of analyzed data, marking the transition from insight to action.
Data-Driven Decision-Making With Brightmetrics
Brightmetrics stands out as a powerful tool in the realm of Unified Communications (UC) and contact center data analysis and optimization. It provides teams with the latest metrics and KPIs, ensuring a thorough understanding of performance through both high-level dashboards and detailed reports. This dual approach of overview and in-depth analysis is pivotal for effective data-driven decision-making.
Brightmetrics’ strength lies in its ability to handle both historical and real-time analytics, offering a comprehensive perspective on contact center operations. This facilitates a more robust and informed decision-making process, allowing teams to identify trends, assess performance, and make adjustments proactively.
By using Brightmetrics, businesses can delve deeper into their data, uncovering more nuanced insights that guide better decisions. This approach is instrumental in optimizing UC and contact center operations and fostering business growth.
Learn more about analyzing and understanding your contact center data with Brightmetrics here.


