Walk into any insurance contact center and you’ll find the same thing: walls of monitors displaying colorful dashboards packed with metrics. Call volumes, handle times, service levels—it’s all there in real-time glory. But here’s the thing that keeps me up at night: most of these dashboards are just expensive wallpaper.
Don’t get me wrong. The data is valuable. Every claim filed, every policy question, every frustrated customer call generates information that could transform how we serve people. The problem isn’t the data—it’s what happens next. Or rather, what doesn’t happen next.
Too many insurance teams treat analytics like a spectator sport. They watch the numbers change but struggle to translate insights into concrete actions. In an industry where customer retention costs significantly less than acquisition and regulatory compliance isn’t optional, we can’t afford to let good data go to waste.
Why Dashboards Alone Don’t Cut It
I’ve seen this pattern countless times: executives invest heavily in analytics platforms, expecting performance to improve automatically once everyone can see the data. It rarely works that way.
Instead, what typically happens is information overload. Teams track 20+ KPIs without clear priorities. Supervisors identify problems but often lack knowledge on who should address them or how. Metrics fluctuate, but without accountability, issues persist until they become crises.
The fundamental issue? Dashboards tell you what happened, not what to do about it. They’re diagnostic tools masquerading as solutions.
Getting Strategic About Metrics
The first move toward actionable analytics is brutal prioritization. You cannot improve everything at once—trust me, I’ve watched teams try. Pick three to five metrics that move the needle on your strategic goals.
For insurance contact centers, these usually include:
Response speed—Because nobody wants to wait on hold after a car accident or house fire. According to Zendesk’s Customer Experience Trends Report, 60% of customers consider long wait times the most frustrating part of customer service.
Customer satisfaction scores—Direct feedback that tells you whether your service actually works for real people.
Claims processing time—How efficiently you move from “here’s what happened” to “here’s your check.”
Transfer rates—A proxy for whether customers reach the right person the first time.
Compliance adherence—Because regulatory violations in insurance can be career-ending expensive.
Learn more about selecting the right KPIs for your contact center to ensure you’re measuring what matters most.
The key is picking metrics that connect directly to business outcomes, not just operational convenience.
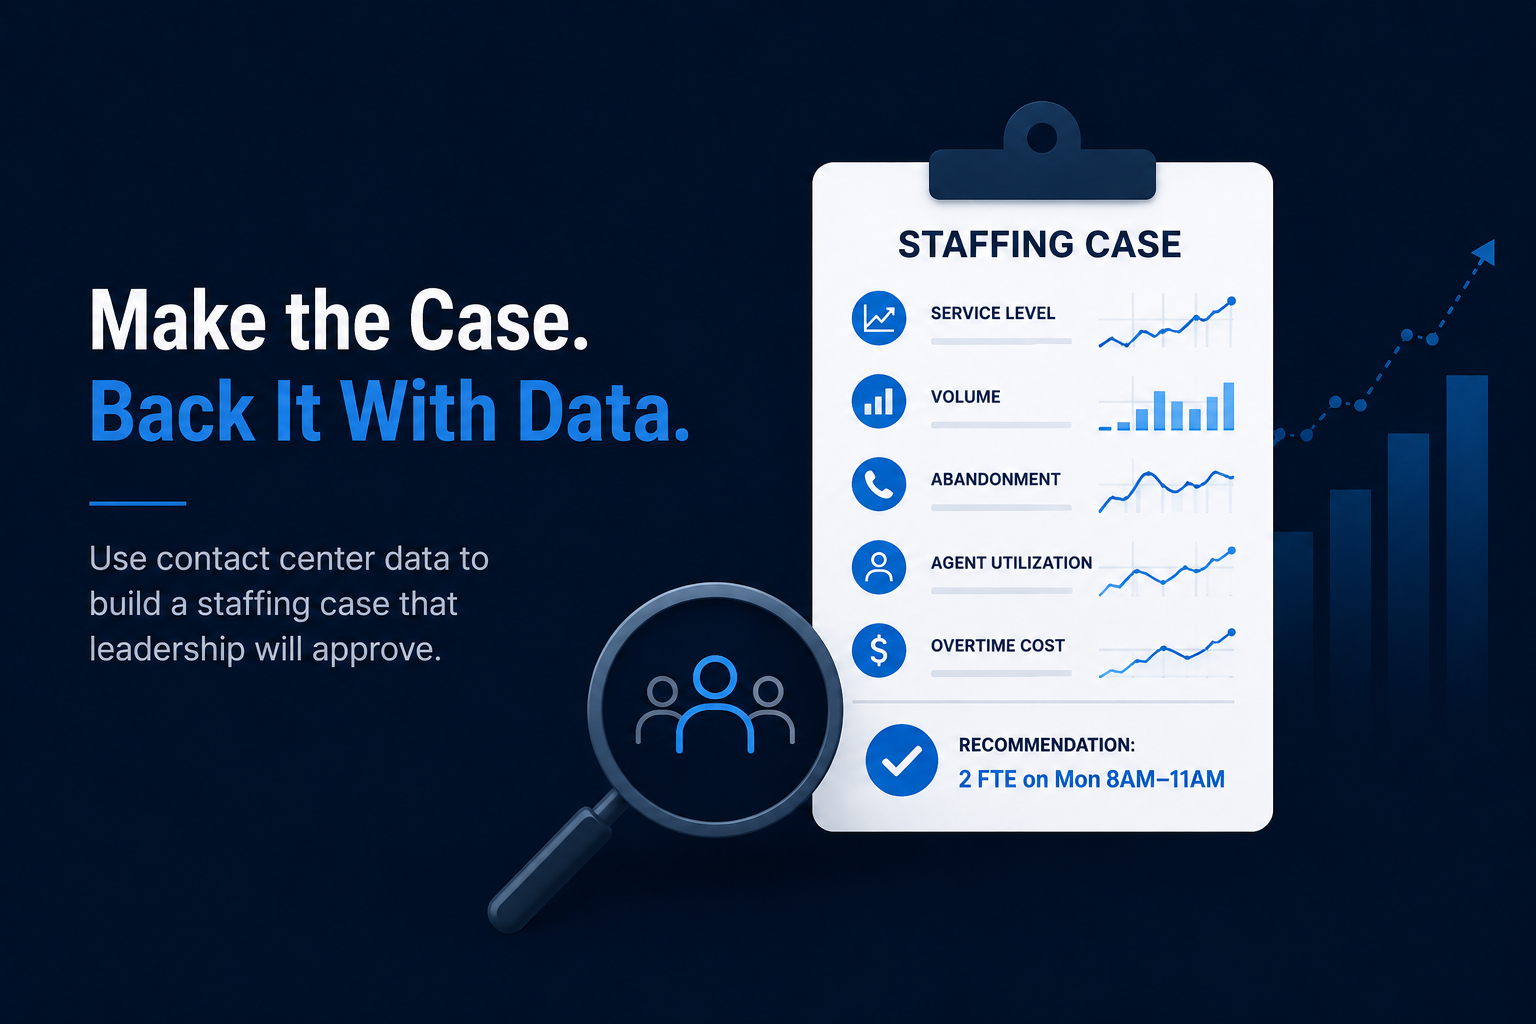
Making Someone Own It
Here’s an uncomfortable truth: data without accountability is just trivia. Every metric needs an owner—someone whose job depends on moving that number in the right direction.
In practice, this might look like:
- Workforce management owns service levels and abandonment rates
- Team leads own transfer rates and resolution metrics for their groups
- Quality assurance owns callback rates and escalation patterns
- Compliance owns regulatory adherence metrics
When everyone owns everything, nobody owns anything. Clear accountability changes behavior fast.
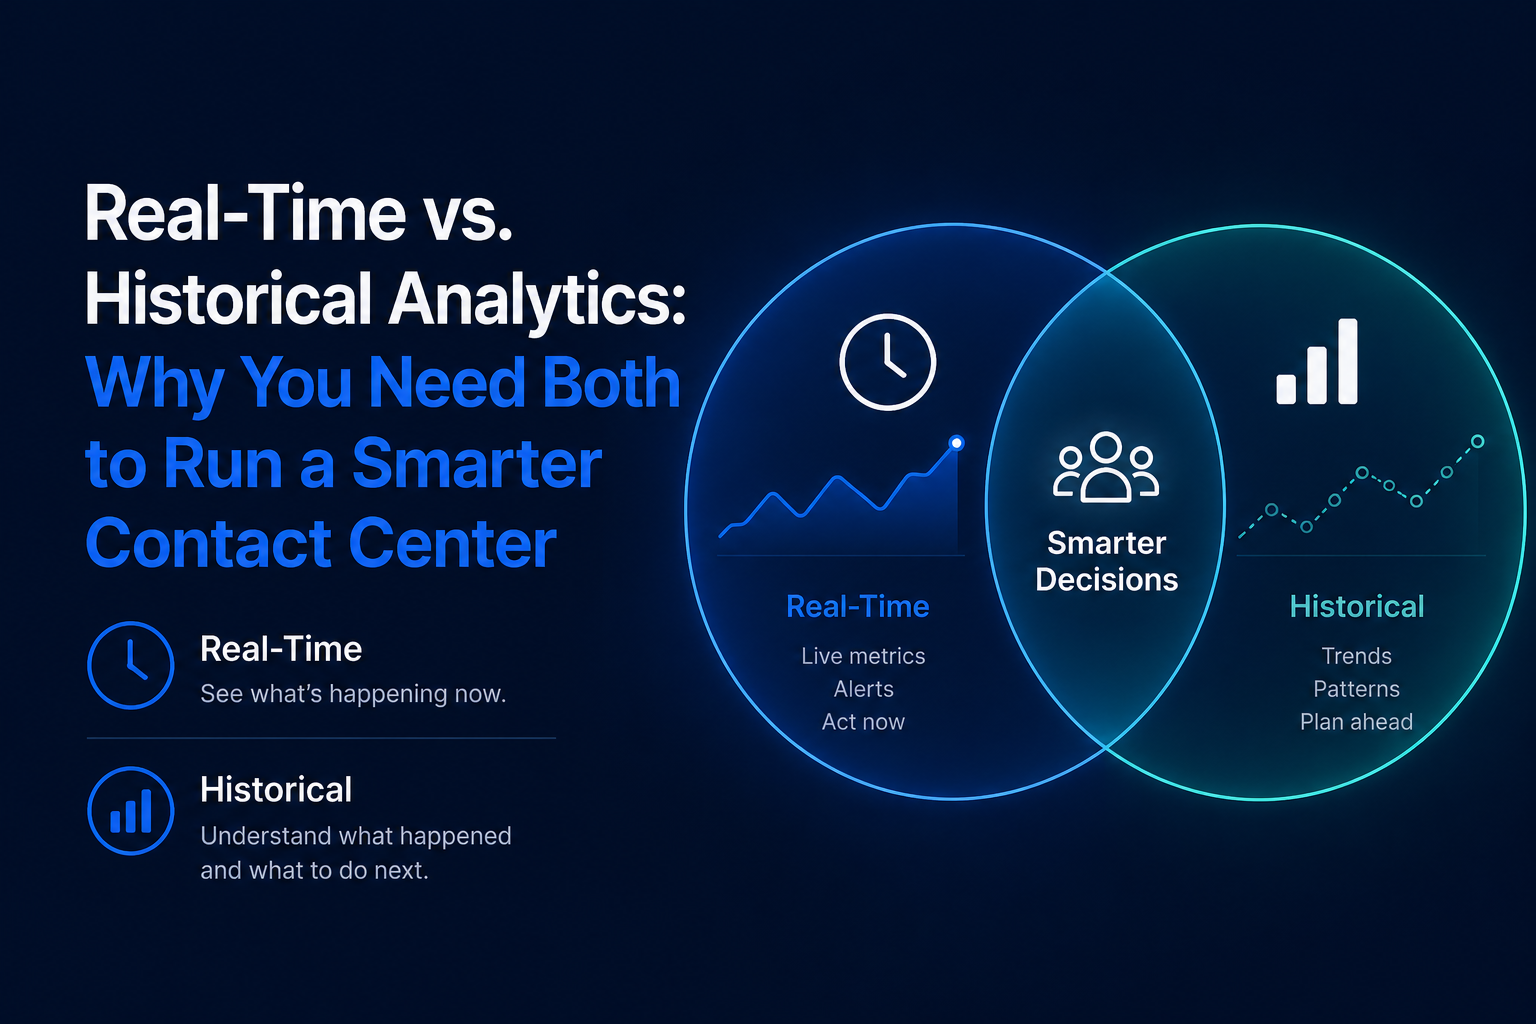
The Real-Time Revolution
Historical reports are autopsies—interesting, but the patient is already dead. Insurance contact centers need real-time visibility because problems compound quickly.
Consider what happens during a severe weather event. Claims calls spike unpredictably. Without real-time data, supervisors are flying blind until it’s too late. With it, they can:
- Spot queue buildups before service levels crater
- Shift agents between claim types based on demand
- Catch compliance issues before they multiply
- Identify agents who might need immediate support
Companies that utilize real-time contact center analytics typically achieve 10-15% higher customer satisfaction scores. The difference between reacting and responding is often measured in customer lifetime value.
Coaching That Actually Works
The best analytics programs don’t just inform managers—they empower frontline agents through targeted coaching. Instead of generic feedback sessions, supervisors can use data signals to guide specific improvements.
When wrap-up times stretch too long, coaching focuses on system efficiency. When transfer rates climb, training emphasizes product knowledge. When compliance alerts fire, supervisors review scripts and reinforce protocols immediately.
This approach works because it’s objective. Agents can see the data themselves. They understand why coaching matters and what success looks like. Over time, it builds a culture of continuous improvement rather than defensive reaction.
Looking Beyond Averages
Averages lie. Your contact center might average six-minute handle times, but what if auto claims take four minutes while property claims take ten? What if premium customers wait twice as long as basic policyholders?
Segmentation reveals these patterns. It shows you where to focus resources, which processes need fixing, and which agents might benefit from specialized training. Companies that segment performance data typically see 20-30% improvement in operational efficiency.
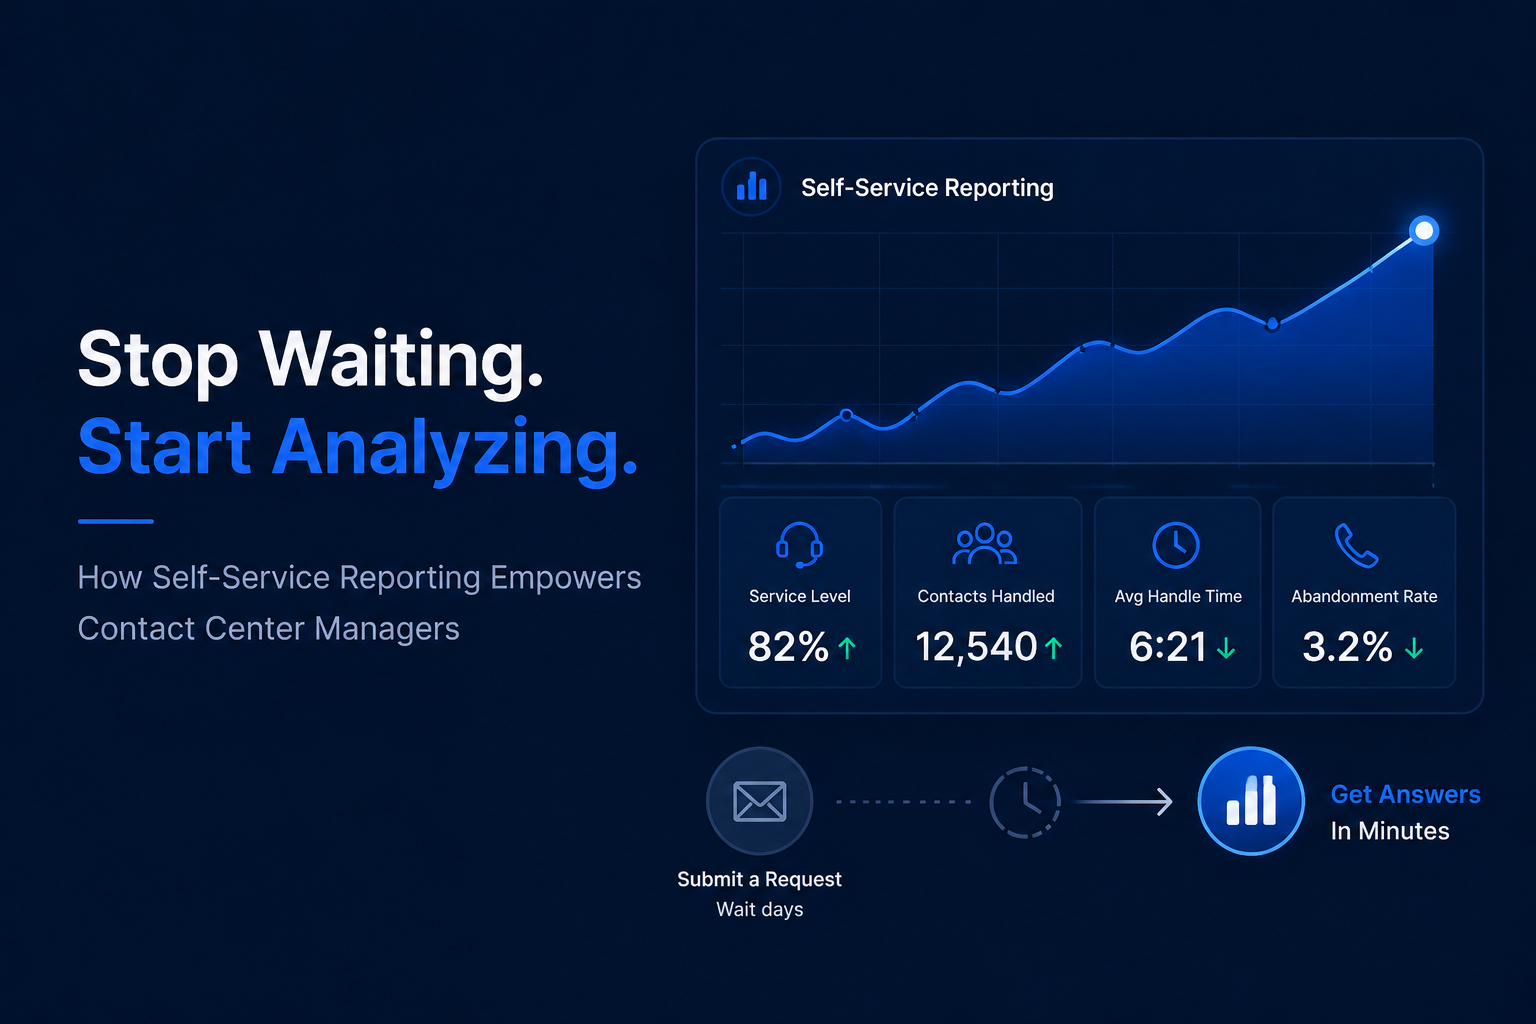
Building Data into Daily Habits
The final piece is routine. Analytics can’t be something teams check occasionally—they need to be woven into how work gets done every day.
Strong operations typically include:
Morning huddles using real-time dashboards to set daily priorities, Midday check-ins to assess whether service levels are on track
End-of-day debriefs to capture lessons and flag escalations. Weekly trend reviews comparing performance against goals
When data becomes part of the daily rhythm rather than the monthly reports, teams stay ahead of problems instead of chasing them.
The Stakes Are Real
Insurance isn’t just any service business. People call when their world has been disrupted—after accidents, during claims, when they need coverage questions answered. Every interaction either builds or erodes trust at moments when trust matters most.
Research shows that customer experience drives insurance loyalty more than price in many segments. When analytics translate into faster, more accurate service, the business impact is immediate and measurable.
Moving from insight to action requires discipline, but the payoff is substantial: quicker resolutions, better compliance, more engaged agents, and customers who feel genuinely heard and valued.
Dashboards provide the “what.” Operationalizing analytics provides the “so what” — and, most importantly, the “now what.”