Accessibility is at the heart of effective contact center management. Without objectives and metrics that enable accessibility, the answers to several questions would be left to chance: How long will customers have to wait? How busy are your agents going to be? What resources (staff and technology) do you need?
Two key objectives—service level and response time—tie the resources you need to the results you want to achieve. They measure the degree to which you’re getting contacts “in the door” and to agents. As a result, they are stable targets for planning and budgeting. Why two objectives? The answer is, there are two major types of work in contact centers.

The Two Buckets of Customer-Related Work: Service Level vs. Response Time
Think of putting all customer-related work into two buckets. The first consists of those interactions that must be handled as they occur. Phone calls, video, chat, text, walk-in customers—any work that needs to be handled at the time is in the service level category. Service level is expressed as “X percent of contacts answered in Y seconds.”
Then there’s the other bucket, which contains work that can be handled later: email, processing work, interactions through social channels that can be deferred, or anything else that does not have to be handled immediately. Response time is expressed as “100 percent of contacts handled within N days or hours.” (If there’s more than one back-and-forth exchange, such as in a technical support center that opens tickets to track problems, there’s an additional layer to response time called resolution. When, after the back-and-forth dialog with the customer, is the issue fully resolved?)
Differentiating between service level and response time is essential because base staff calculations vary for these two major categories of contacts. Service level-type work occurs randomly and must be handled as it happens. To determine the staff required, you’ll use either the queuing formula Erlang C or computer simulation.
Both are widely available as part of workforce management packages or as stand-alone programs or calculators.For work characterized by response time, you can rely on traditional planning methods based on how many items an individual can process in an hour or day. Even if the same agent group handles both service level and response time interactions, which is fairly common, you’ll calculate staff requirements in layers for each.
The Service Level Balancing Act: Finding the Right Target for Your Industry
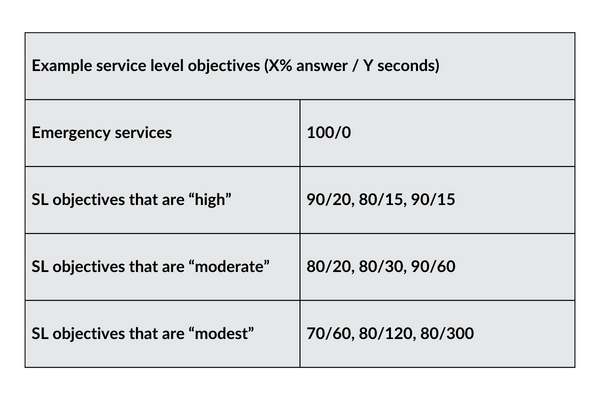
For service level, if you’re in a competitive industry and want to be on the high end of the scale, 90/20 is fairly common. If you hit this target consistently, your customer abandonment rate will likely be no more than 1 percent to 2 percent. (Some managers ask, why not answer all calls immediately? The answer is, that would require as many agents as simultaneous calls—highly impractical.)
If you’re going for the middle of the road, a service level objective of 80 percent answer in 20 seconds is typical. Meet it consistently, and you’ll generally see 3 percent to 5 percent abandonment rates.
Organizations establishing more modest service levels often target 70 percent answer in 60 seconds, or even 80/300. Abandonment might be 10 percent or more. But hold your judgment—some of these organizations do an excellent job of consistently hitting these objectives with the resources they have.
Average speed of answer (ASA) is an alternative to service level. However, I recommend service level because it tends to be more stable, and more accurately represents the experience of customers (for example, 80% received an answer within 30 seconds).
Keep in mind that ASA averages all customers, including those who don’t wait at all, so the number can look misleadingly favorable. (The one scenario in which ASA will provide better guidance than SL is if queues are so long that NO percentage of contacts reach agents within Y seconds. In that unenviable circumstance, ASA will provide better relative tracking.) I also recommend that you avoid establishing abandonment as your measure of accessibility.
You can’t control how customers will react or the myriad circumstances that influence their behavior. But you can control how accessible you are—the service levels you establish and how many agents are handling workloads. Concentrate on service level, and abandonment will take care of itself.

Choosing Response Time Objectives
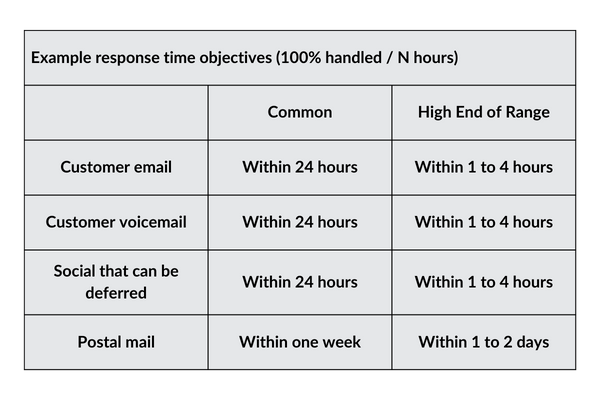
What about response time objectives, for interactions such as customer email? A 24-hour turnaround is a common goal. But some organizations have upped the ante to four-hour or even one-hour objectives. In fact, some use an SL-like approach and schedule enough staff to handle interactions as they occur; customers LOVE that level of response. Go with what’s right for your brand and feasible for your operation.
How Poor Quality Impacts Service Level
Accessibility and quality go hand in hand. Consider how poor quality jeopardizes service level. For example, what happens when data is not entered correctly? If the customer does not have confidence the contact was handled correctly? If you did not capture needed and valuable information? These problems contribute to repeat and escalated contacts, driving down service level.
The problems tend to compound. When service level drops, customers begin channel hopping or sending simultaneous contacts. Reports are less stable for planning purposes. As service deteriorates, more and more customers express their frustration to agents, who have to spend valuable time apologizing. Agents eventually pace themselves, further backing up queues.In short, better quality means less waste and rework. And better service levels give your agents the room they need to breathe and deliver the best quality.
Staying Ahead of the Accessibility Curve
As you establish your objectives, here are two final recommendations. First, to the degree you can, keep an eye on how service level and response time performance evolves in other organizations. That will impact the expectations customers have of you. (Be cognizant of how accessibility is evolving in the broader business environment.) Second, remember that it’s not just how high your objectives are but how consistently you hit them, day after day and half hour after half hour.
I recall working with two different insurance companies that reported the same SL performance. But the results were, in fact, very different. One reported service level as an average for the month but was predictably getting clobbered mid mornings (especially on Mondays). When they had a bad morning, they’d make sure plenty of agents were available later to bring the average up. By then, it was too late for customers, and the organization missed opportunities to get other things done those afternoons, such as training and process improvement.
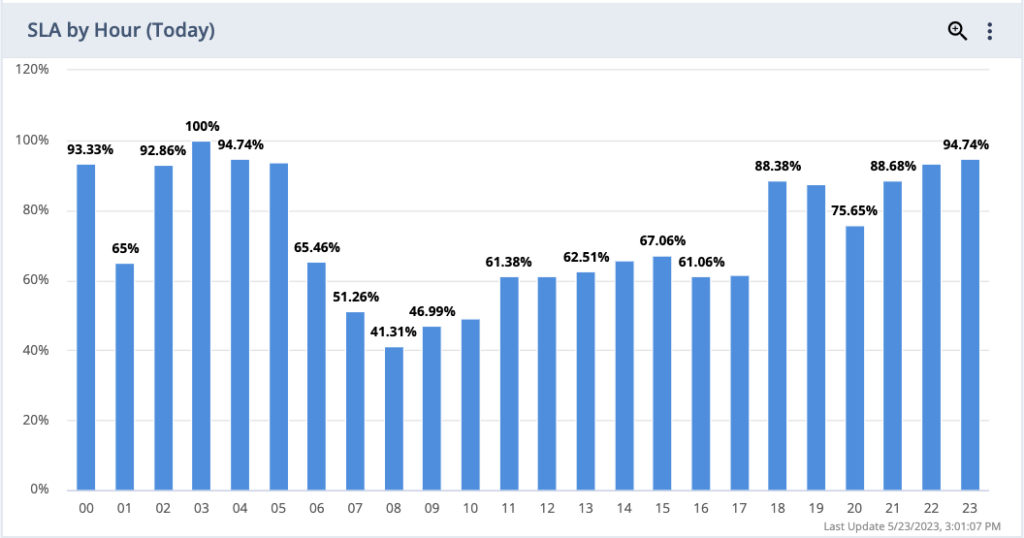
The other organization had far happier customers and employees. As it turns out, they delivered service much more consistently. They tracked and managed accessibility by increment, by half hour, rather than across the day and month. The overall result was a far better and more consistent experience for customers and employees.
Well-managed contact centers set specific objectives down to the time of day. They then work hard to hit them consistently.
From the Brightmetrics Team: How Analytics Help You Optimize Accessibility
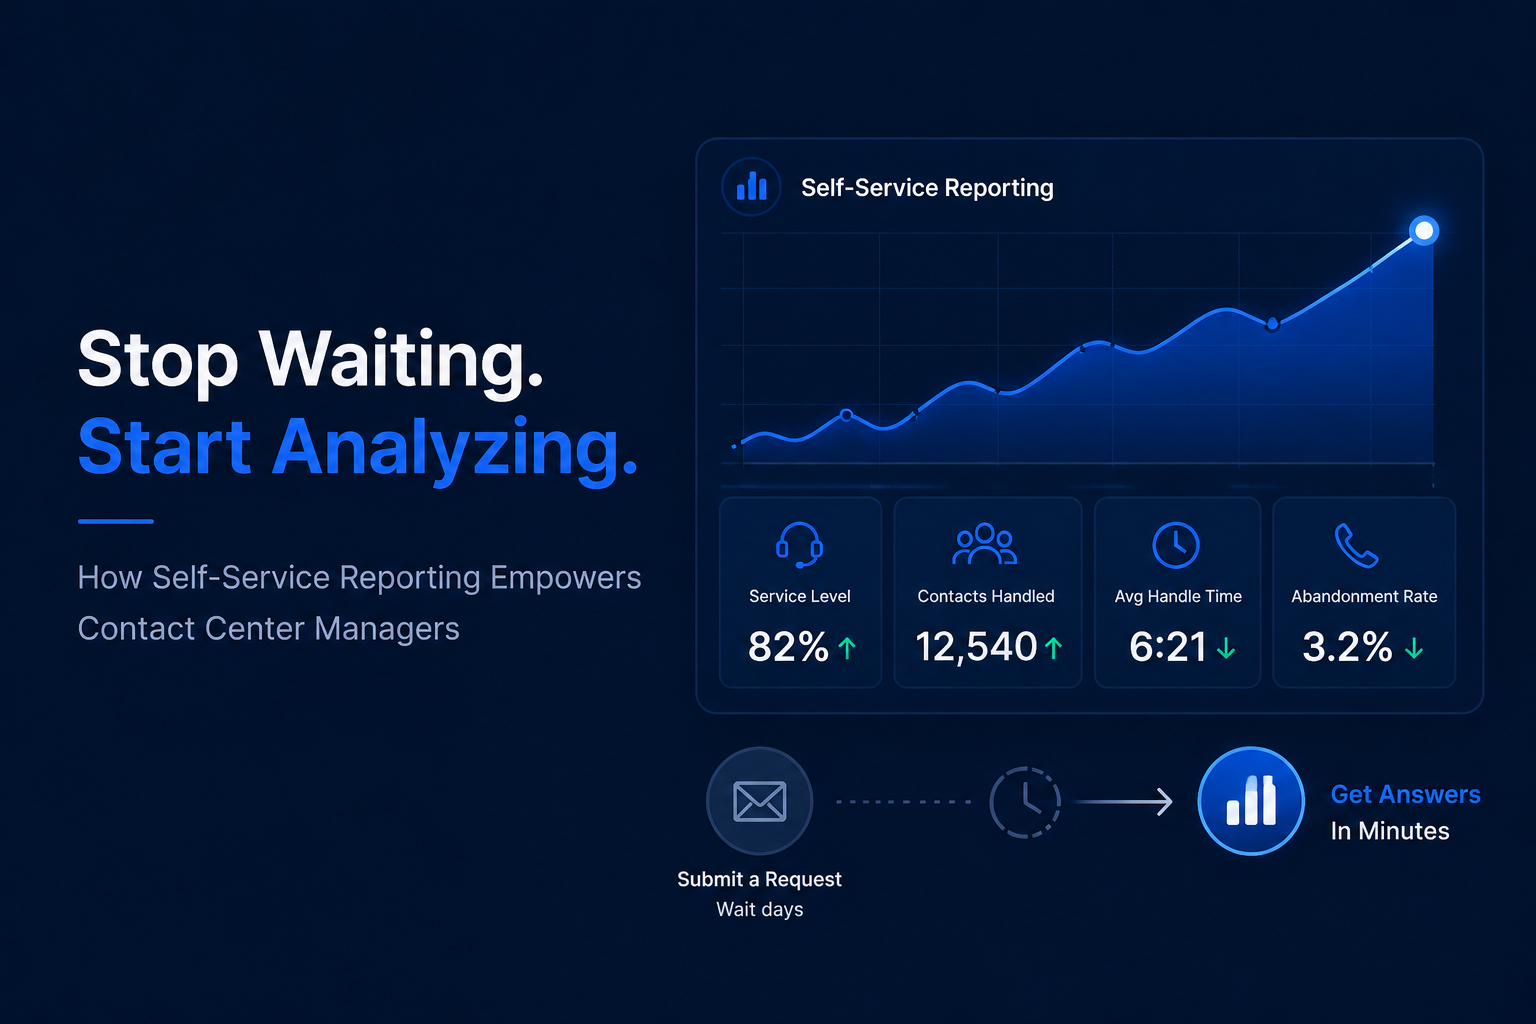
Achieving a deep understanding of accessibility and the factors that drive results requires robust analysis. This level of analysis is crucial in measuring and optimizing accessibility in your contact center, as it directly impacts the delivery of exceptional customer experiences. To enable this level of insight, you need powerful analytics and reporting tools that provide actionable information. Enter Brightmetrics™, a comprehensive analytics and reporting service designed specifically for UC and contact center systems.
With Brightmetrics, you gain the ability to effortlessly measure and acquire valuable insights on various aspects of your contact center’s performance. This includes SLA calculations, service level breakdowns by different time intervals (such as month, day, hour, half hour, and 15-minute increments), and response time metrics. By harnessing the capabilities of Brightmetrics, you can effectively track your service level and response time objectives with precision, ensuring that you consistently meet and surpass customer expectations.
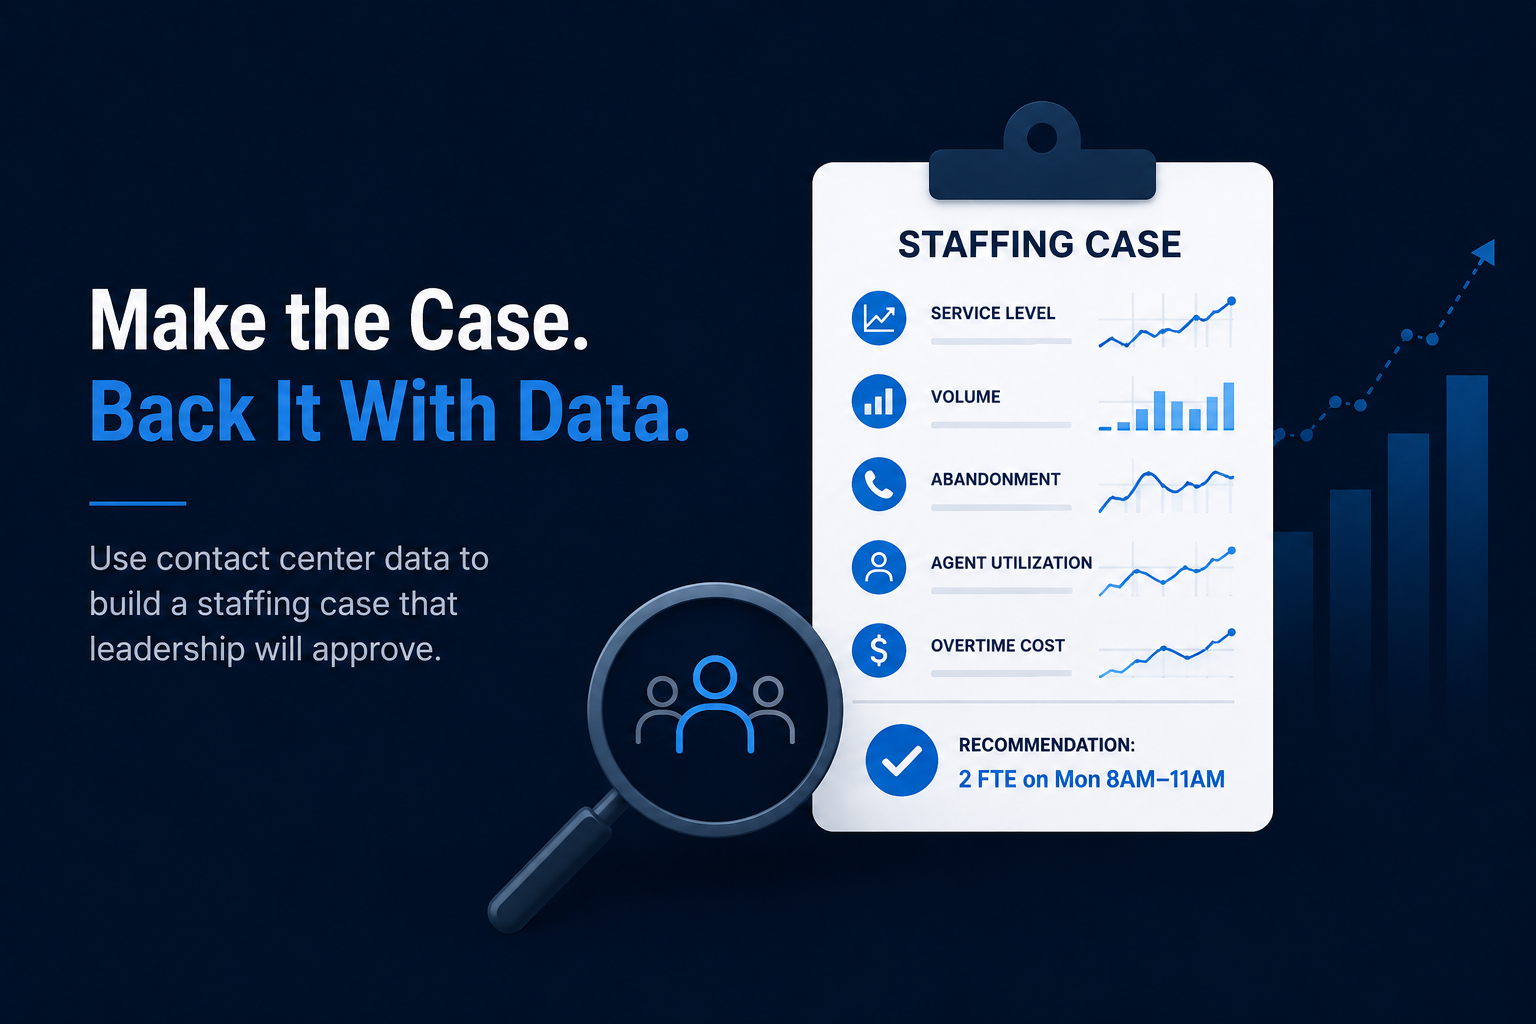
The granular visibility into your contact center’s performance that Brightmetrics provides empowers you to identify patterns, optimize staffing levels, and make informed, data-driven decisions. Proactively managing your contact center’s accessibility becomes a reality with Brightmetrics, leading to happier customers, more productive agents, and enhanced operational efficiency.
When it comes to measuring and enhancing accessibility in your contact center, don’t settle for guesswork. Start your free trial of Brightmetrics today and unlock the full potential of your contact center.