Contact centers get a bad rap. Most customers would rather spend their time on a variety of other tasks than contact their insurance customer service center. In fact, nearly a quarter of Americans surveyed would rather shave their head than speak to a customer service rep, while 22% would prefer to spend a night in jail. However, insurance company call centers or contact centers can drastically reduce wait times and change their customers’ perceptions by providing excellent and speedy customer service with the help of measuring the right KPIs.
Some KPIs are better to measure than others in the insurance industry. Once you’ve identified the right KPIs that align with your performance goals, teams can generate unparalleled intelligence about the customers they engage with. Learn more about the most critical insurance call center KPIs to track below.
1. Average Speed of Answer
How long does it take your contact center agent to answer a customer call? The speed agents answer the phone can make all the difference between a good customer experience and a bad one. Average Speed of Answer (ASA) calculates the average time it takes for an agent to answer a call in your contact center once a customer is in the queue. Call center KPIs like this one can have a direct impact on customer satisfaction.
Improving the average time it takes your team to answer calls will provide customers with a more pleasant experience. This being particularly true in the insurance industry, where customers may be frustrated or more often upset because they have been in an accident or someone has broken into their home. They expect a speedy and efficient response from your agent if they need to claim on a policy.
2. Abandon Rate
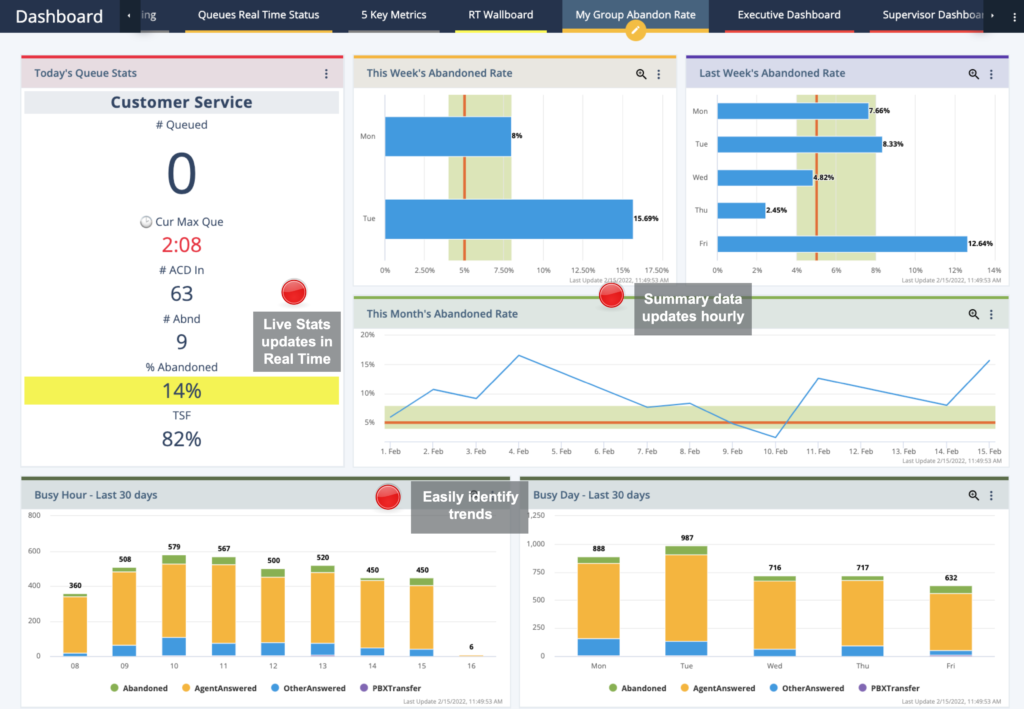
Abandon rate (or abandonment rate) is another insurance call center experience KPI that is important to track. It measures the percentage of customers who hang up the phone before reaching an agent. For example, when a customer puts down the phone after waiting in a queue for 20 minutes. A high abandon rate means too many customers hang up the phone waiting to speak to an agent, suggesting your team is understaffed or reps are taking too long to wrap up conversations.
Customers who abandon calls will likely still need to contact your center at a later date because their issue has not been resolved. However, continued attempts to get through to your agents will only frustrate these customers and clog up lines.

The ideal average contact center abandonment rate is around 5-8%, with anything above these numbers considered poor. Inbound mobile calls typically have a higher abandon rate than those on landlines. Still, aim to keep your rate as low as possible.
Your contact center can do this by delegating calls to the right agents, hiring additional reps during busy periods, and keeping customers engaged with helpful IVR messages. Remember, customers might not renew their insurance policies if they have to wait too long to speak to an agent, so tracking call center KPIs like abandon rate is imperative.
3. Hold Time
Hold time is another KPI that relates to how long your customers have to wait to speak to an insurance agent. This metric measures the average number of seconds a customer is on hold during a single call, including wait times during transfers (when an agent forwards the customer’s call to another agent or supervisor). Waiting too long on hold can easily disappoint customers. Even when there’s a legitimate reason for an agent placing someone on hold — for example, to check their account or speak to a supervisor — customers hate waiting for a resolution, especially during stressful situations.
Putting a customer on hold can also indicate poor-quality service because it can seem like an agent doesn’t know what they are doing. If your contact center manages calls on behalf of an insurance company, it might have to keep hold time within an agreed timeframe per its service level agreement. This metric is extremely useful when you want to please that client. Fail to improve hold time, and you could jeopardize your business.
There are different ways you can improve hold time. For example, training agents to manage various call types can reduce transfers and help customers to solve issues in a quicker time frame. However, it’s best to monitor this metric consistently to determine the extent of the problem (if there is one) in your contact center.
KPIs for Your Insurance Call Center: Final Word
Call center KPIs like Average Speed of Answer, Abandon Rate, and Hold Time provide you with valuable performance insights for your contact center. Brightmetrics™ helps you better understand and visualize these metrics with powerful analytics. View insights on customizable dashboards, drill down your most valuable data, and make better data-driven decisions for your team.
Learn more about improving your call center customer experience with Brightmetrics.


