The Analytics Tool Your Team Bought Six Months Ago: Is Anyone Still Using It?
Most contact centers that buy analytics tools go through the same experience. The purchase gets made. Implementation happens. Training sessions run. For a few weeks, adoption looks promising.
Then it fades. The same few people use it. Reporting requests still go to IT. Decisions still get made without the context managers needed. The tool sits mostly unused, and nobody quite knows how to explain why.
This is not unusual. It is the default outcome when a tool is purchased based on what it can do in a controlled environment rather than whether it actually fits how managers work.
Good contact center analytics does not impress people in demos. It gets talked about in Monday morning reviews. It shows up in decisions that happen faster and problems that get caught earlier. The test is not how the tool looks. It is whether people are using it every day.
What Good Analytics Actually Does
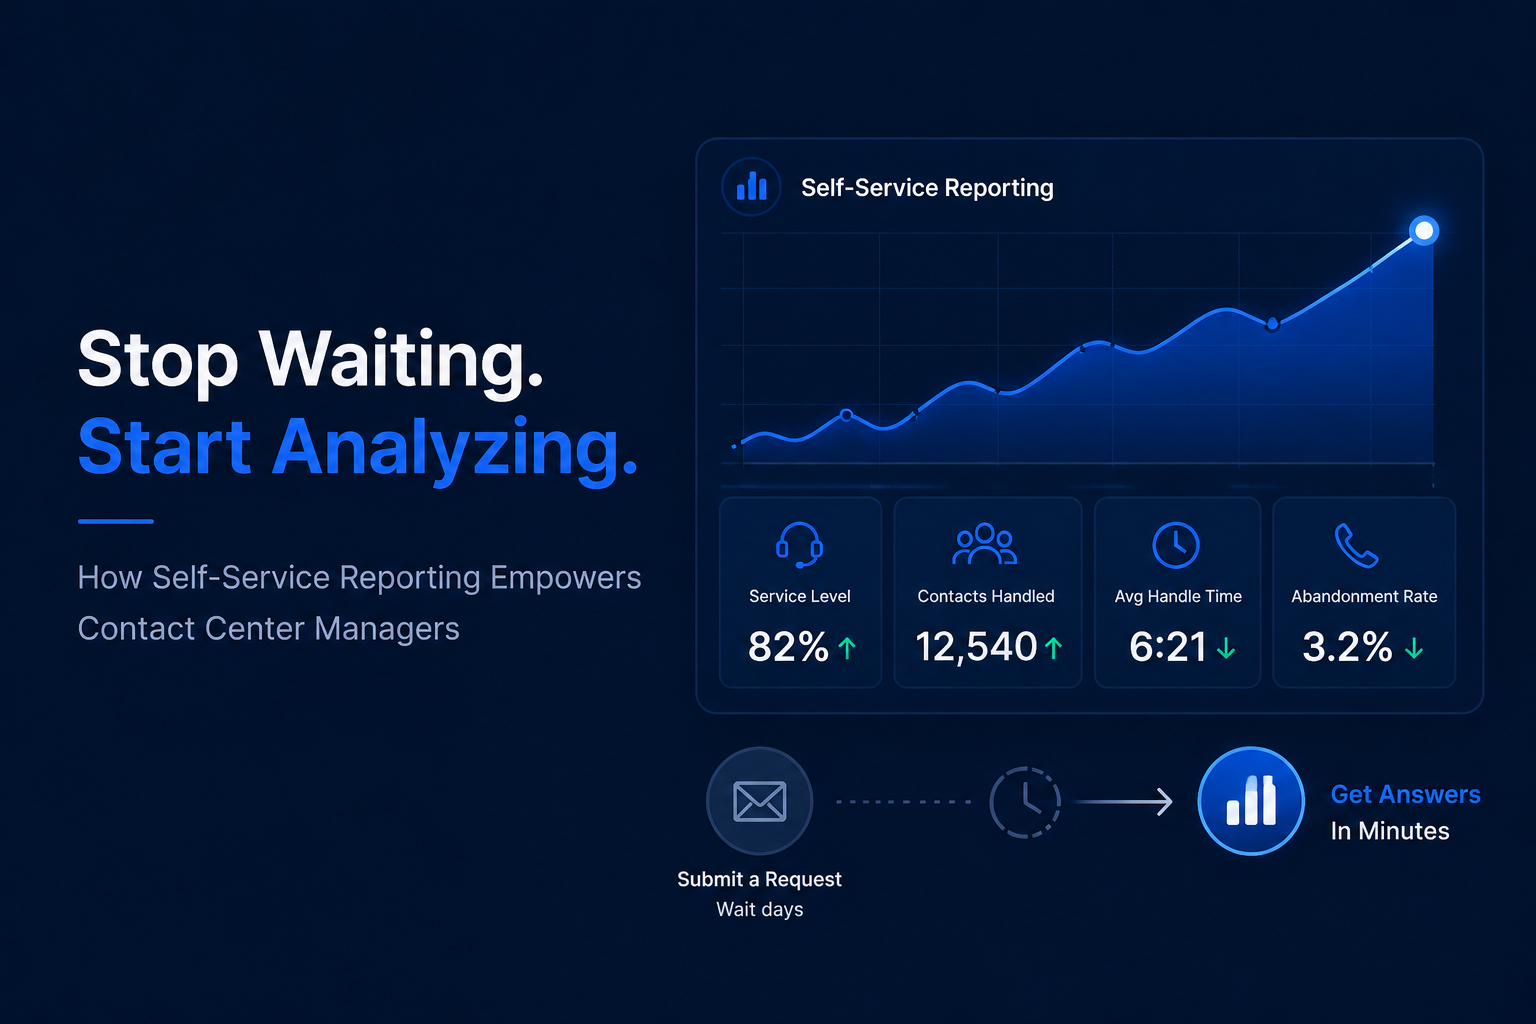
It Answers Questions Fast
The measure of a good analytics tool is not how many metrics it can display. It is how quickly a manager can get from a question to an answer. If the tool requires significant configuration, training, or technical knowledge to answer common operational questions, it will not get used consistently enough to change anything.
Speed matters. A tool that answers questions in two minutes gets used. A tool that takes 20 minutes to configure a report gets used once a week if that. And the questions that do not get asked because the tool is too slow to bother with are real operational blind spots.
It Works for Non-Technical Users
Contact center managers are operations experts, not data analysts. A good analytics tool is designed for the person who needs the answer, not for the person who builds the system.
If only one or two people in the organization can use the tool fluently, the organization does not have analytics. It has a dependency. When that person is out or moves to another role, the operation loses its data access.
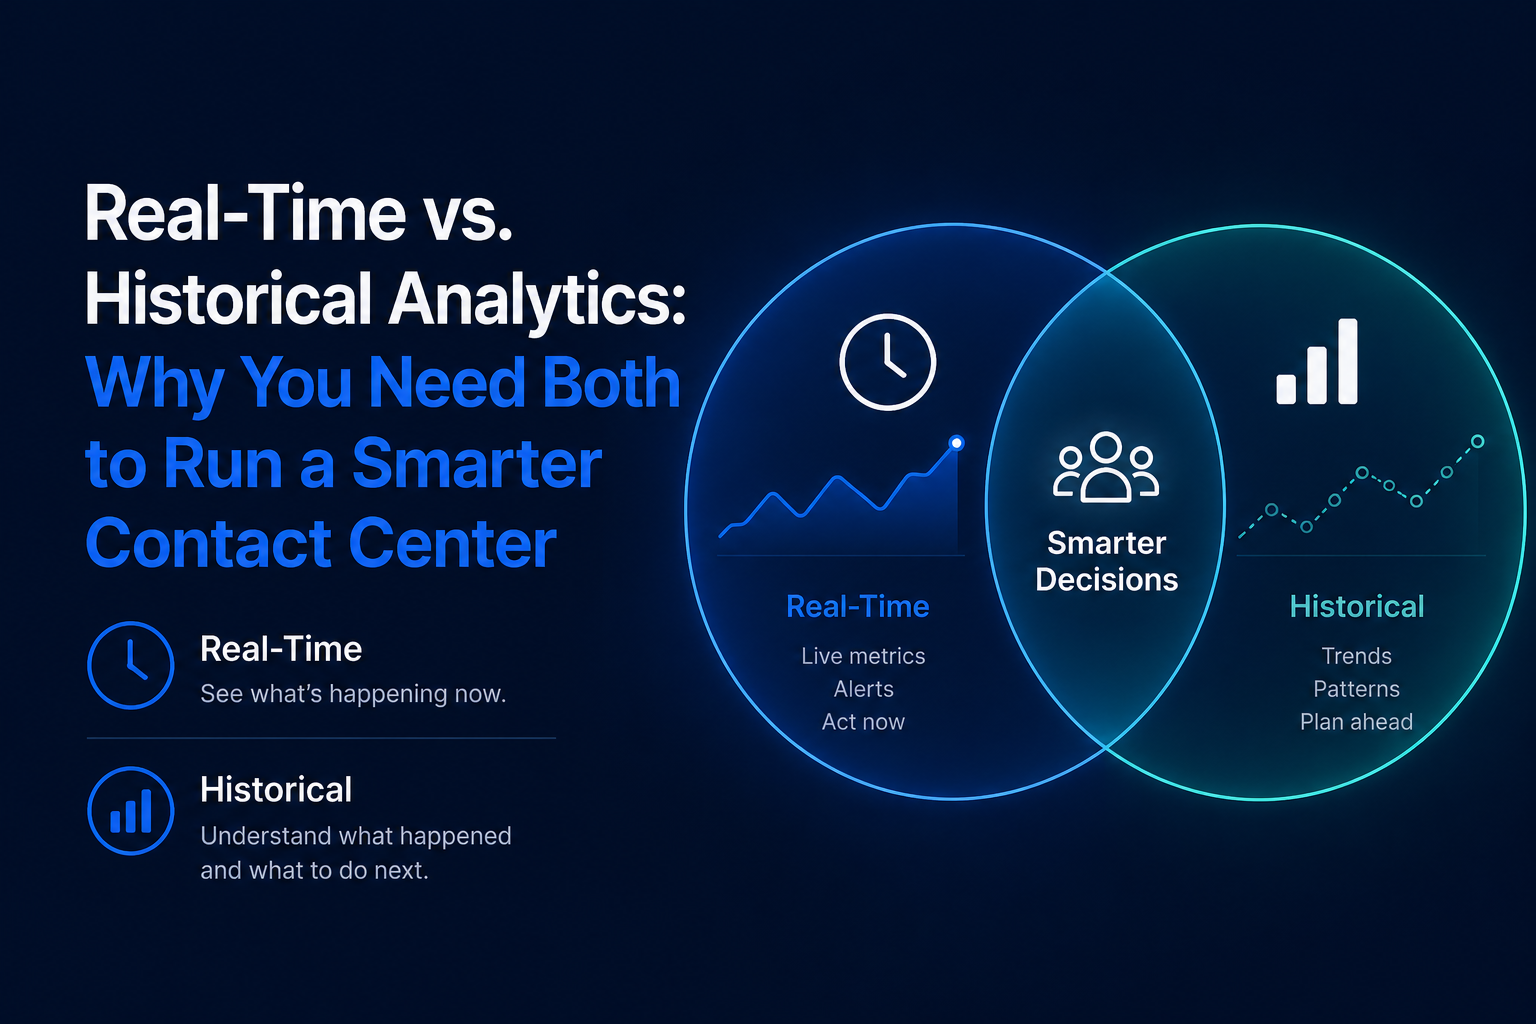
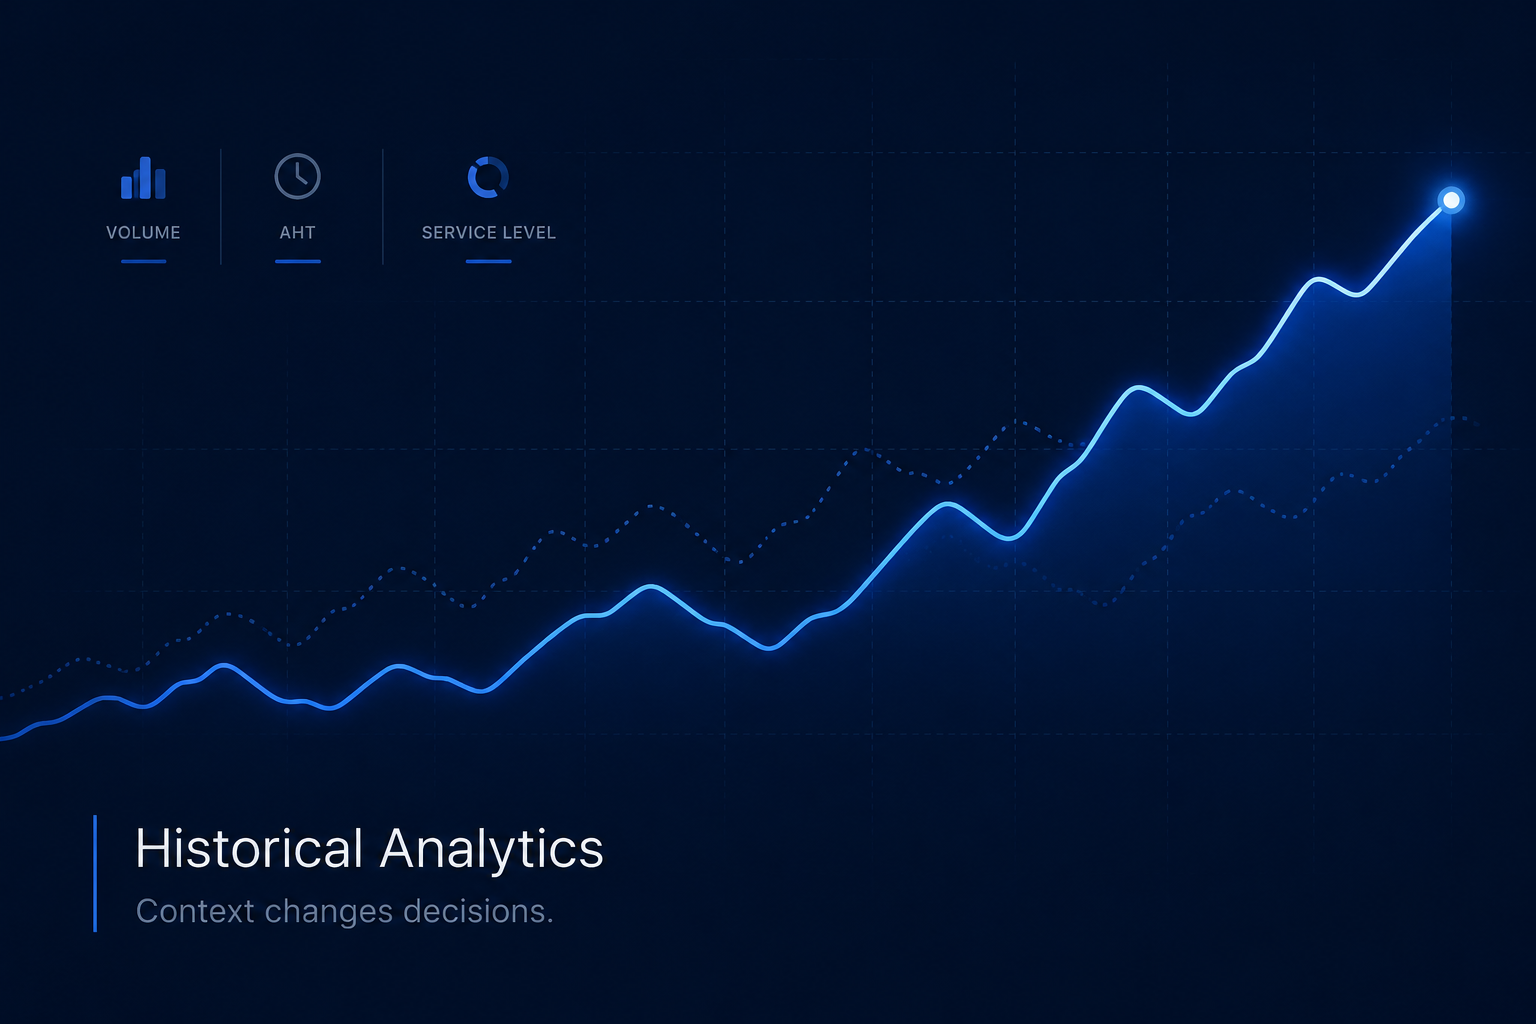
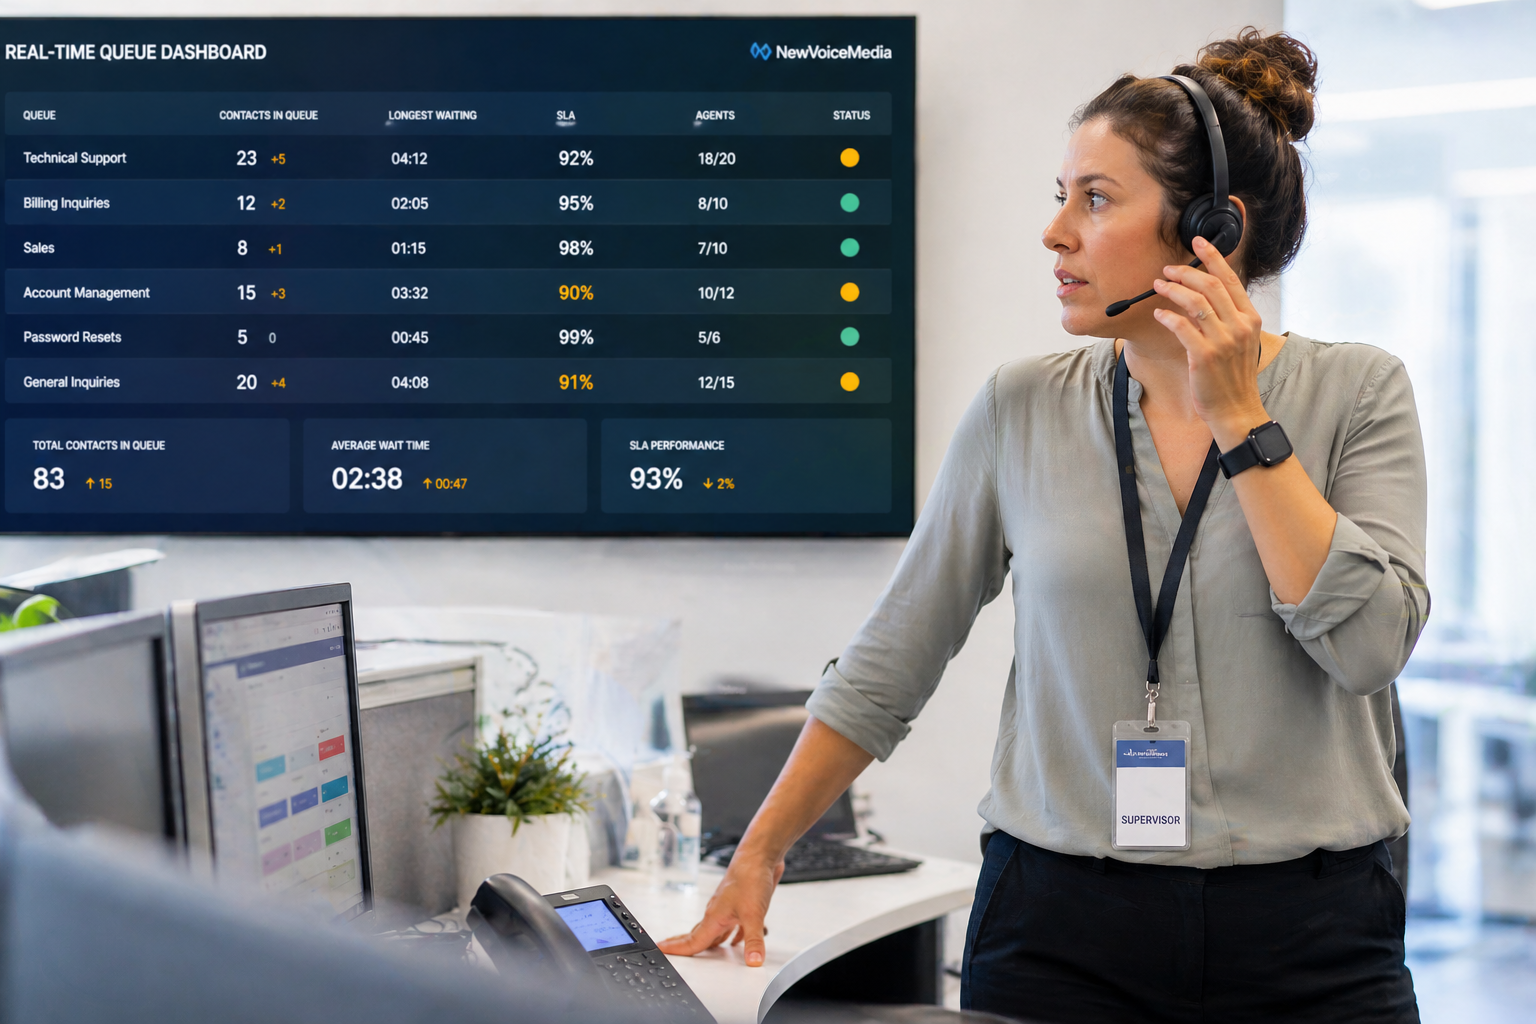
It Connects Real-Time and Historical Views
A supervisor managing a live queue needs real-time data. A manager planning next month’s staffing needs historical trends. A director making a budget case needs both. A tool that handles one but not the other forces workarounds that erode the value of both, and the workarounds are where adoption quietly dies.
It Lets You Drill Down, Not Just Look Up
Summary metrics are starting points. When something looks off, the useful question is why. Good analytics lets you move from the summary to the detail in clicks. Which calls? Which agents? Which hours? Which queues?
Without that drill-through path, a metric can move and you have no path to understanding what drove it. The metric becomes decorative: you can see that something changed but you cannot do anything useful with that information.
It Integrates With What You Already Have
Adding an analytics layer should not require replacing your contact center platform or migrating data. The right tool connects to your existing Genesys Cloud, Mitel, or RingCentral deployment and surfaces the data that is already there in a more accessible form.
What Good Analytics Is Not
It is not a dashboard with 40 metrics that no one looks at. More metrics is not more insight. It is more noise.
It is not a tool that requires an IT ticket to get a custom report. If managers cannot modify views themselves, most questions will stop getting asked.
It is not a system that shows real-time data well but cannot answer historical questions without significant effort. The questions that require historical context are often the most consequential ones.
It is not software that requires a dedicated analyst to get value from. Concentrating access in one analyst creates a dependency, not a culture.
It is not a product that looks impressive in a demo and sits mostly unused six months after implementation. That is the default outcome, not the exception.
The Questions Worth Asking Before You Choose a Tool
Can a non-technical manager build a custom report without help? How far back does the historical data go and how easy is it to access? Can you build separate dashboards for different roles and audiences? When something looks off in a metric, how quickly can you get to the underlying detail?
Test with real operational questions, not demo scenarios. Ask to pull six months of service level data by hour and queue. Ask a non-technical manager to build a custom dashboard. See how long it takes and whether the result is actually useful. That exercise tells you more than any feature list.
Frequently Asked Questions
What should contact center analytics software include? Real-time monitoring, historical trend analysis, customizable dashboards, drill-through capability, automated reporting, and role-based access are the core capabilities. The most important thing is that non-technical users can access all of those capabilities without depending on IT or an analyst.
How do you evaluate contact center analytics tools? Test with real operational questions, not demo scenarios. The tool that answers “what was service level by hour in the billing queue for the last six Mondays” in two minutes for a non-technical manager is the tool that will actually get used.
What is the difference between reporting and analytics? Reporting shows you what happened. Analytics helps you understand why and what to do about it. The difference is drill-through capability, flexibility, and the ability to explore data rather than just receive it in a fixed format.
The Bottom Line
Good contact center analytics is not about having more data or more dashboards. It is about having the right data accessible to the right people fast enough to change how decisions get made.
The test is not whether the tool looks good. It is whether managers are using it every day to answer questions they could not answer easily before.
Brightmetrics is built for that standard. It connects to your existing Genesys Cloud, Mitel, or RingCentral platform, works for non-technical users, combines real-time and historical views, and lets managers drill from any summary metric to the underlying detail without waiting on IT or an analyst.