Having a reliable, real-time dashboard is crucial for optimizing agent productivity, improving customer experience, and ensuring operational efficiency in your contact center. Brightmetrics, a premium Genesys AppFoundry partner, offers a robust analytics platform designed for Genesys Cloud users. In this blog, we explore how to create a real-time dashboard in five minutes or less using Brightmetrics.
Why Real-Time Dashboards Matter
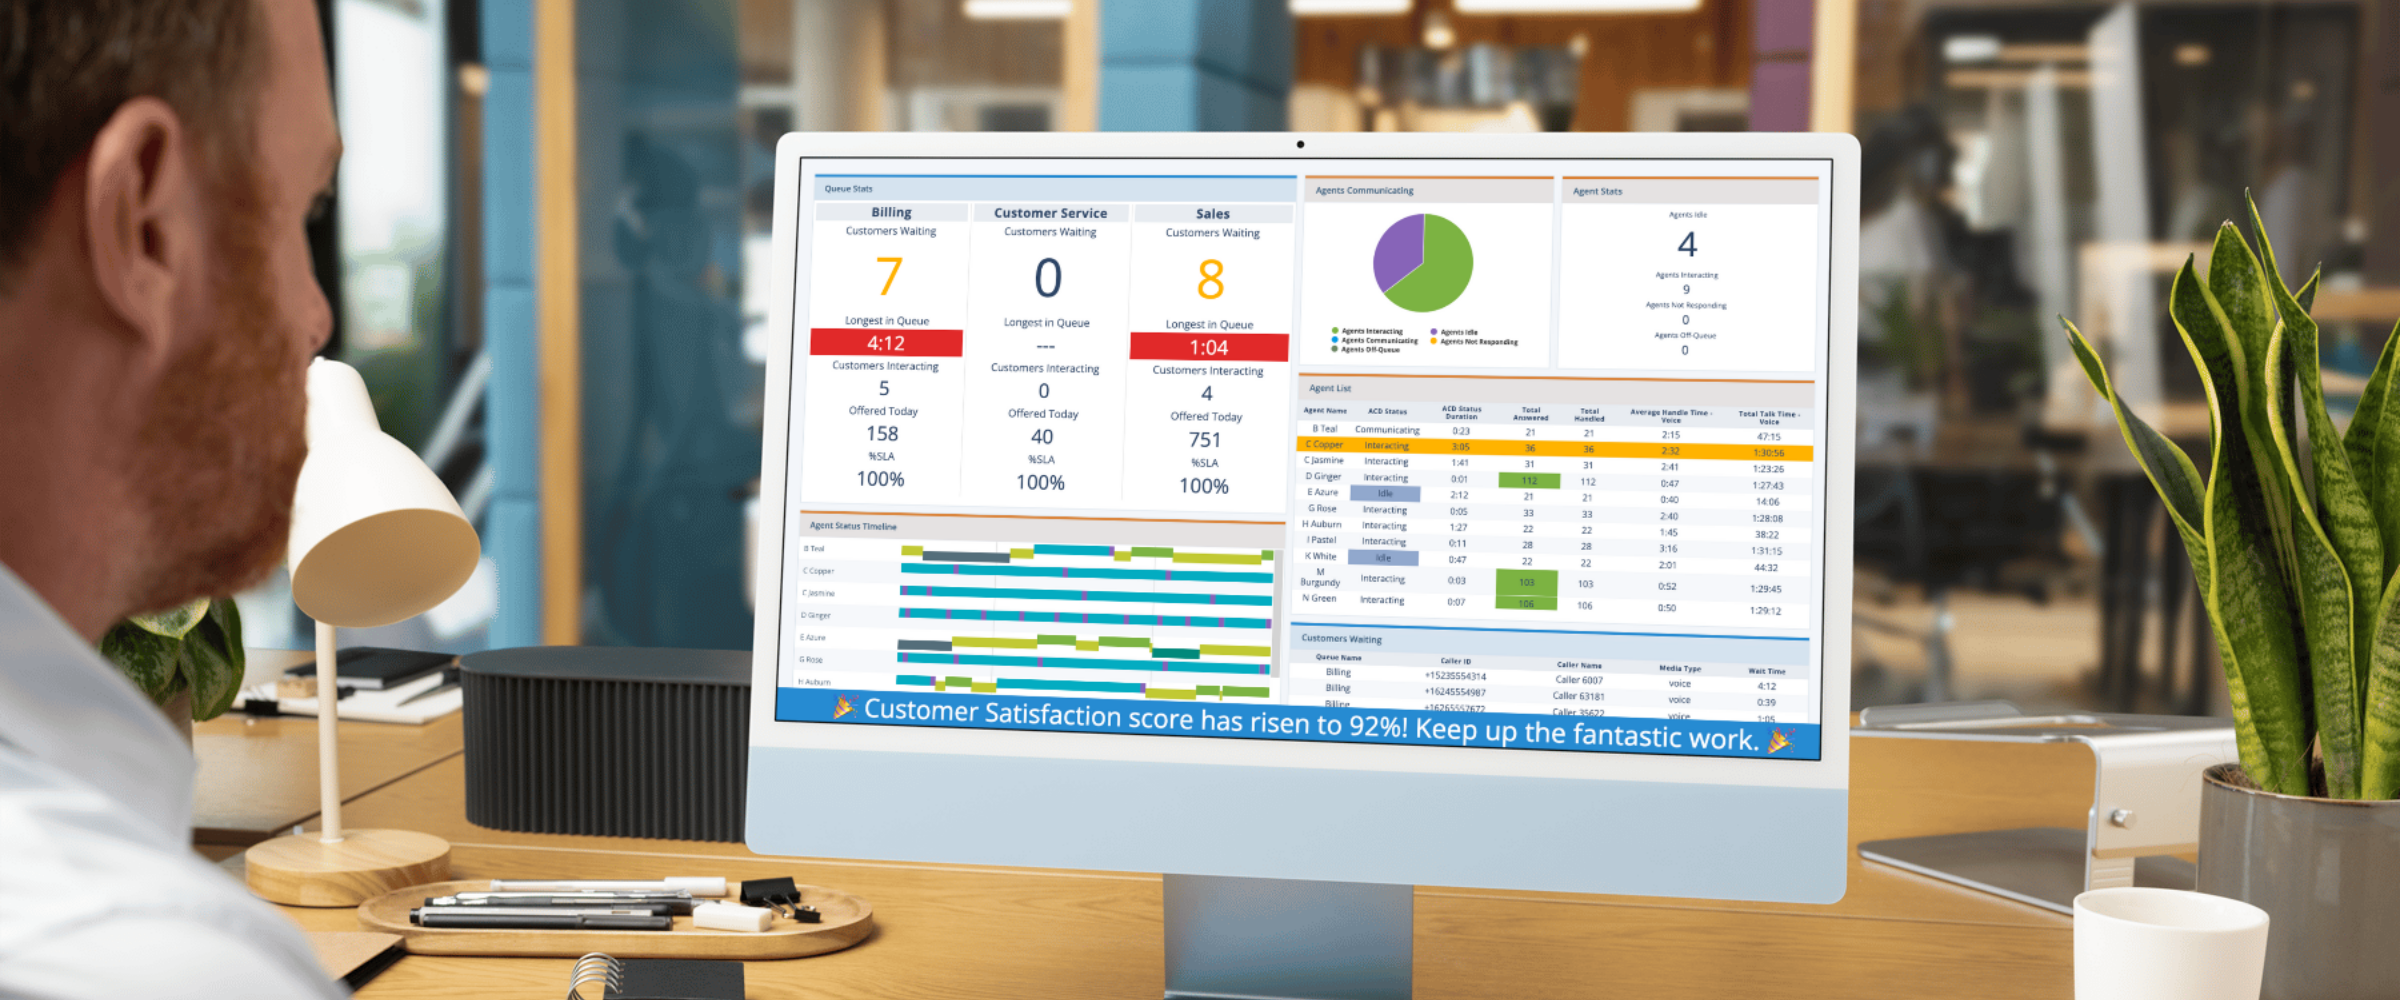
Real-time dashboards provide immediate visibility into key metrics such as queue statistics, agent status, and customer interactions. Genesys Cloud’s native performance views offer some insights. Still, they often require users to switch screens and lack the flexibility and ease of use that many contact centers need. Brightmetrics enhances this functionality by offering a single-pane view that consolidates real-time and historical data into an intuitive dashboard.
Step 1: Start with a Template
Creating a dashboard from scratch can be time-consuming, so Brightmetrics offers pre-built templates to get users up and running quickly. These templates are based on everyday use cases and customer feedback. Users can choose between combined or separated queue views depending on their operational needs. Once a selection is made, a list of queues is presented, allowing users to select the relevant ones for their dashboard.
Step 2: Customize Metrics and Layout
Once the initial dashboard is created, customization options allow users to tailor it to their specific needs:
- Editing Metrics: Users can add or remove key performance indicators (KPIs) such as answer percentage, transfer rate, or longest queue time.
- Filtering Data: Filters can be applied to display only the most relevant agent or queue data.
- Adding Alerts: Users can set up smart alerts to highlight specific agent behaviors, such as prolonged idle time, using color coding and sound notifications.
- Drag-and-Drop Layout: The dashboard offers a flexible interface, with elements that can be resized and arranged to best suit the user’s viewing preferences.
Step 3: Enhance Visualization with Additional Elements
In addition to real-time stats, users can enhance dashboards with:
- Historical Data: Adding trend analysis for better decision-making.
- Clocks & Images: Useful for branding or displaying time zones in global operations.
- Agent Status Timelines: A unique feature in Brightmetrics that visually represents an agent’s activity throughout the day, helping managers track performance.
Step 4: Share and Publish Dashboards
A common challenge with Genesys Cloud’s native dashboards is sharing access without incurring high licensing costs. Brightmetrics addresses this with various sharing options:
- User Permissions: Dashboards can be shared with internal team members and external consultants.
- Published Links: Users can create public links that allow access without requiring login credentials.
- IP Restrictions: For added security, published dashboards can be restricted to specific networks.
Step 5: Utilize the Dashboard Ticker
For real-time communication, Brightmetrics offers a scrolling ticker feature. This can be used to:
- Communicate essential updates, such as system alerts or policy changes.
- Send quick messages, like announcing incentives or breakroom updates.
- Enable text-based updates from supervisors, allowing real-time changes to be reflected on the dashboard.
Try It Yourself
Brightmetrics makes it easy to build, customize, and share real-time dashboards in just a few minutes. Whether you need a quick overview of call queues, detailed agent performance tracking, or an intuitive way to communicate with your team, Brightmetrics provides the flexibility and intelligence required to optimize contact center operations.
If you’d like to try it yourself, you can set up a free 30-day trial and have your first dashboard up and running before the end of the day. Reach out to the Brightmetrics team for more information and start maximizing your Genesys Cloud investment today!
Note: This blog is based on a Brightmetrics webinar presentation by Peter Hornberger, VP of Sales and Customer Success at Brightmetrics, focusing on real-time dashboard creation and customization.