Building a contact center dashboard can be grueling and for a good reason. These dashboards must highlight correct, relevant, and up-to-date information in order to best inform your teams. But with the sheer volume of interaction data available, one can easily get lost in the details. Information translated into your dashboards must be compiled from multiple sources, analyzed, and presented in an organized fashion. A poorly designed contact center dashboard hinders the manager’s ability to improve team outcomes.
When building your dashboards, follow these tips to ensure the most critical data is visible and actionable at a glance.
Focus on the Goal
Each dashboard you build serves a purpose and answers critical questions. For example, a high-level executive dashboard may provide details on the organization’s overall business goals and focuses on finances, such as revenue growth, revenue per client, and profit margin. Team dashboards supply contact center managers with agent performance insights and identify the center’s workflow issues.
This information – such as Average Speed of Answer or the Average Abandonment Rate – also helps identify agents who may need further training. A customer experience dashboard highlights how customers feel about their overall experience with the contact center. The information, e.g., Net Promoter Score (NPS) or Customer Satisfaction Score (CSAT), can be used in tandem with the team dashboard to highlight troublesome areas in the agent workflow. Focusing on the correct goals helps avoid cluttering dashboards with KPIs that aren’t useful.
Consider Your Audience
Your audience is one of the most important considerations when building a dashboard. Who’s going to use it? What purpose will it serve? For example, contact center agents would most likely be interested in seeing information regarding their performance. A personalized agent dashboard helps them track progress toward individual and team goals.
Managers, however, will need to see metrics for the entire team. The manager focused dashboard offers the capacity for planning insights and pinpoints areas to address with the team or individuals. Most of your dashboards will be internal or even restricted to specific roles within the company, but sometimes, an organization may want to share boards with external partners. For example, you can create and share a summary dashboard for a customer to highlight the call center’s performance on service-level agreements.
Select the Correct Type of Dashboard
Continuing with the point above, each contact center dashboard will serve different needs throughout the call center. It is vital to select the correct dashboard based on who needs it. Here are a few additional options:
Agent Activity and Performance
The agent performance dashboard shows metrics designed to help supervisors monitor team performance. This type of dashboard may consist of charts showing Busy Hour, Call Count By Exit Reason, Average Handle Time, and Agent Stats.
Training and Coaching
Call center agents navigate a wide variety of customer issues each day. If they are not well-trained, their performance will suffer. Training dashboards help identify areas where the teams need additional coaching. Information for this type of dashboard might include KPIs such as Average Response Time, daily Abandonment Rate and Average Hold Time.
Real-Time Metrics
With the rise of big data, companies have large volumes of real-time data that contain valuable insights. Real-time dashboards provide visualization and analytics that quickly identify issues and alerts for immediate action to resolve them. Common metrics for this dashboard include Average Queue Time, Agent Status, Handled Reasons Today or Agent Activity Timeline.
Executive Overviews
An executive dashboard provides a high-level view of the company’s performance to drive decision-making. An executive dashboard helps identify continuous improvement opportunities, benchmark company performance, and identify areas for process improvement. This dashboard could take a strategic format with long-term strategies or an analytical one to help leaders with forecasting and spotting trends.
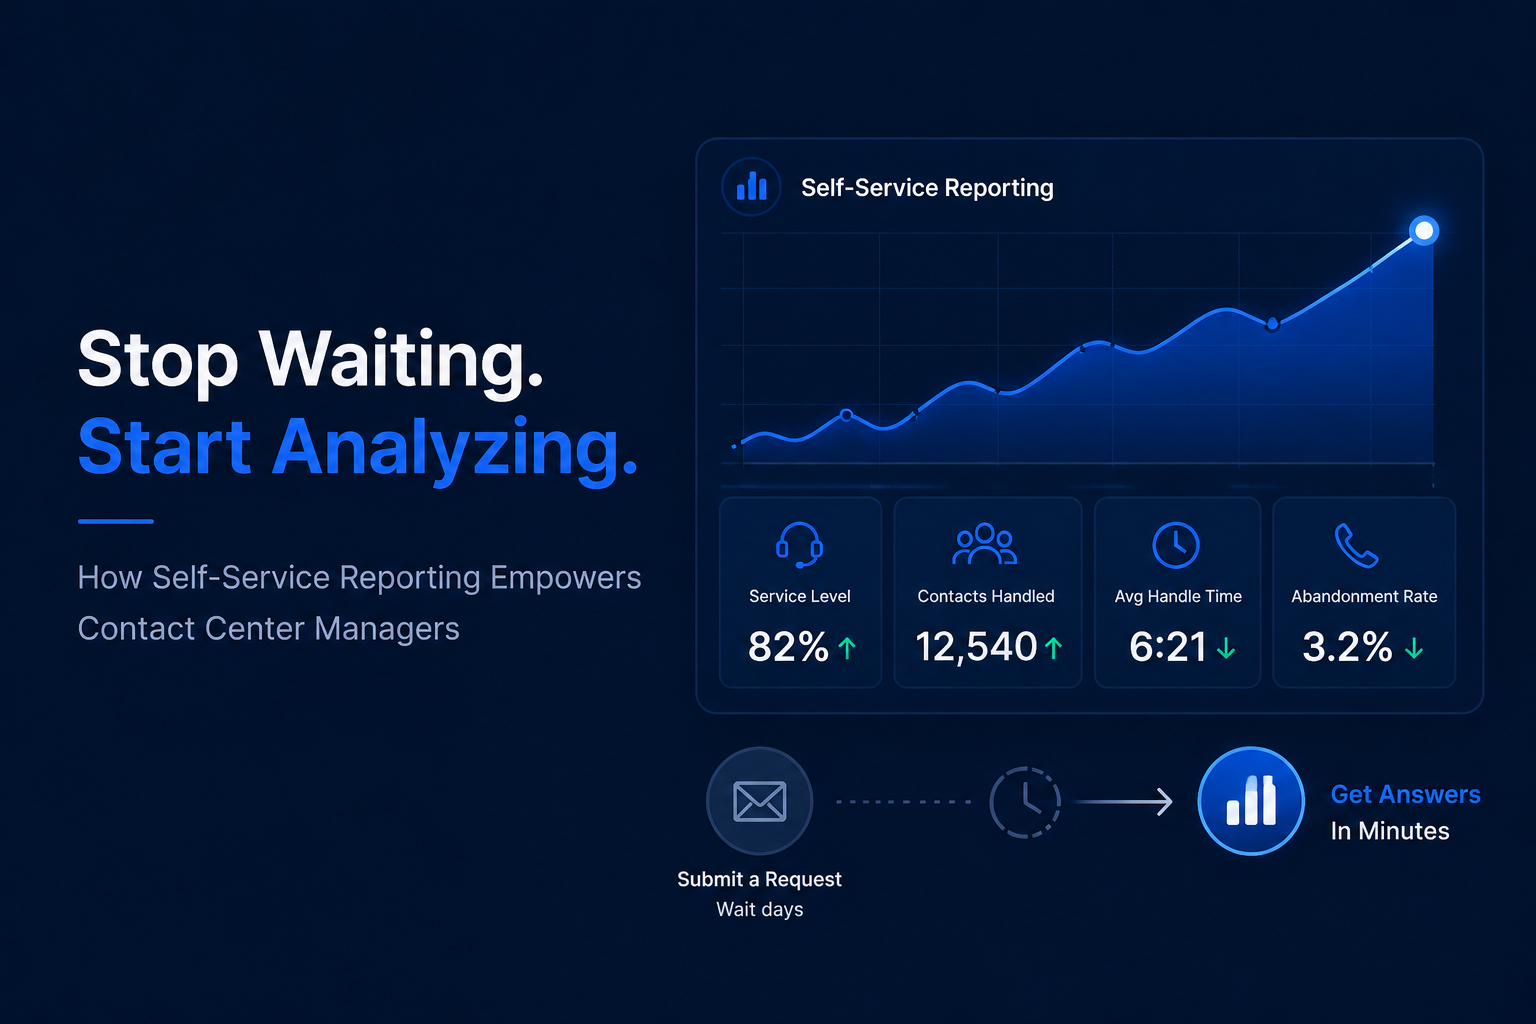
Provide an At-a-Glance Experience
Dashboards should be easy to read and understand. Be sure to select the correct formats to display information effectively; for example, use a line chart to track changes over a specific timeframe. If you want to highlight comparisons, a bar chart is ideal.
Tools like Brightmetrics offer dashboard functionality that makes it easy to select, filter and organize charts and graphs as needed. With the simple drag-and-drop tool, team members can quickly build and display their dashboards in minutes.
Tell a Story
Present a narrative with your contact center dashboards, visually communicating your story in a clear and actionable way. Keep in mind the narrative changes based on the report timeframe. For example, statistics from a single day will tell a different story than information spanning several months or a year.
Contact Center Dashboards: Key Takeaways
Contact center dashboards are vital to informed decision-making. Leaders rely on this information to track team performance toward goals – and, more important – empower them to course-correct when problems arise. Brightmetrics’ dashboards are user-friendly, flexible, and packed with the features you need to gain deep insight into your contact center’s performance. Take your dashboards beyond the basics with powerful analytics, simple reporting tools, and real-time data.
Creating powerful dashboards for your contact center has never been easier. Discover if Brightmetrics is right for your contact center.