Creating your own call center agent gamification program can feel like a stressful, daunting task. However, we are here to tell you that it doesn’t have to be awful. It’ll take a little bit of time, but the outcome will be more than useful in teaching your team how to better work towards their performance goals as well as hold themselves accountable.
In this article, we dive into how you can use your call center data more efficiently and transparently to encourage your call center team to self-manage and compete amongst themselves.
Watch this!
Gamification Metrics
In the video, we outlined a bunch of metrics under the umbrellas of Customer Experience and Operational Efficiency that you could use in your own gamification program.
For example:
- Average Handle Time
- Average hold time
- Percentage of calls transferred
- Calls taken/made
- Percentage of calls answered
- Wrap time/After Call Work
- Wrap code adherence
- Agent Idle/Available time
This is an exciting process so it’s natural to want to maximize everything right now – but that doesn’t work well for call center agents. Giving them 15 different benchmarks and expecting them to excel in each and every one of them overnight is a stretch.
Be Strategic and Deliberate: Pick 5 Metrics
This will force you to find the biggest impact on your customer experience and overall efficiency so that your agents can hit your goals. The mix of those 3-5 metrics is going to be different for everyone. But, the best place to start looking is going to be the same across the board – your top performers.
You know who these people are, so investigate what makes them different – perhaps they transfer fewer calls, answer the phone more consistently, or put customers on hold for shorter periods of time.
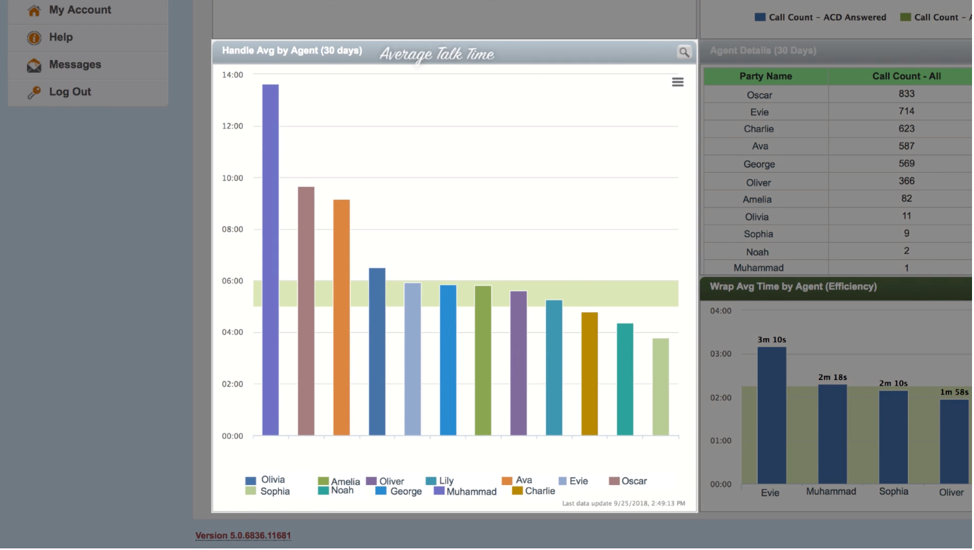
Look at graphs and charts like these to determine how your top performers differ from the rest of your team. Then, pick the metrics that have the biggest impact, or that have the largest divide between general agents and the top performer.
Here Is an Example
Let’s build our own program. We’ll call it our STAR program.
We picked 3 metrics to motivate our team around:
- Average Handle Time
- Percentage Calls answered
- Total Login TIme
And for those of you using advanced call center applications, let’s add in a couple of metrics that would apply in your environment:
- Average Wrap time
- Percentage Release Time
First up – Average Handle Time. Good agents are usually going to show up somewhere around the average of our overall group with this metric. They’re not wasting time on the phone, but they are making sure callers get what they need by going the extra mile. We’re going to have outliers on either side, but what we want to target is that midline. In our hypothetical call center, the midline is around 6 minutes. So, our handle time goal will be below 6 minutes.
Now, we’ll probably have some agents whose average handle time is over 7 or 8 minutes. It’s going to be a little harder to get these agents to shift under 6 minutes overnight, so we’ll want to set an easier goal initially.
Here, we’ll try for a handle time under 7 minutes. Then, over time, as our team succeeds at that goal, we’ll lower the benchmark to 6:30 and then to 6:00 and beyond. If the team feels like the goal is unattainable, they won’t try to reach it. So, we have to make sure to strategically consider what they can actually accomplish, step by step.
Some Metrics May Not Require a Deep Dive
Since we know our team is supposed to work around 30 to 40 hours in a week and we want to make sure they are available for calls most of that time- we’ll set a benchmark to ensure they are doing just that.
Now, if our team has other functions and logs out during meetings or special projects, we’ll need to adjust for that, as well. The data can be helpful to see how much time the team logs in on average in any given week.
For those of you on contact center applications, you have the added benefit of Release time where you can monitor break times.In Brightmetrics™, we can set benchmarks around the available time or percentage of time in release and on breaks.
See below for an example.
We’ll go through this process with each metric we’ve identified for our program. On Percentage of Calls Answered, we’re going to set the benchmark to 95% and higher. For Login Time, we want 25 hours or more per week. And for Wrap Time we’re shooting for under 2 minutes and 15 seconds.
Since this was the first run at the program, don’t worry too much about perfection here. We now have a simple gamification program designed!
To learn more about gamification in the call center, read our next blog in this series: Maximize Call Center Performance With Gamification.
Or, if you missed our first post (and video!) on gamification, read it here: 3 Steps To Motivate Your Call Center with Gamification.