Making quick, informed decisions is key to enhancing contact center performance. Relying on outdated data or cumbersome spreadsheets can leave you playing a guessing game, often leading to decisions that are no longer relevant.
The solution? Real-time dashboards.
These powerful analytics provide up-to-the-minute data insights, allowing you to swiftly adapt and make informed and timely decisions in your contact center. Discover how leveraging real-time dashboards can transform your approach to customer engagement decisions.
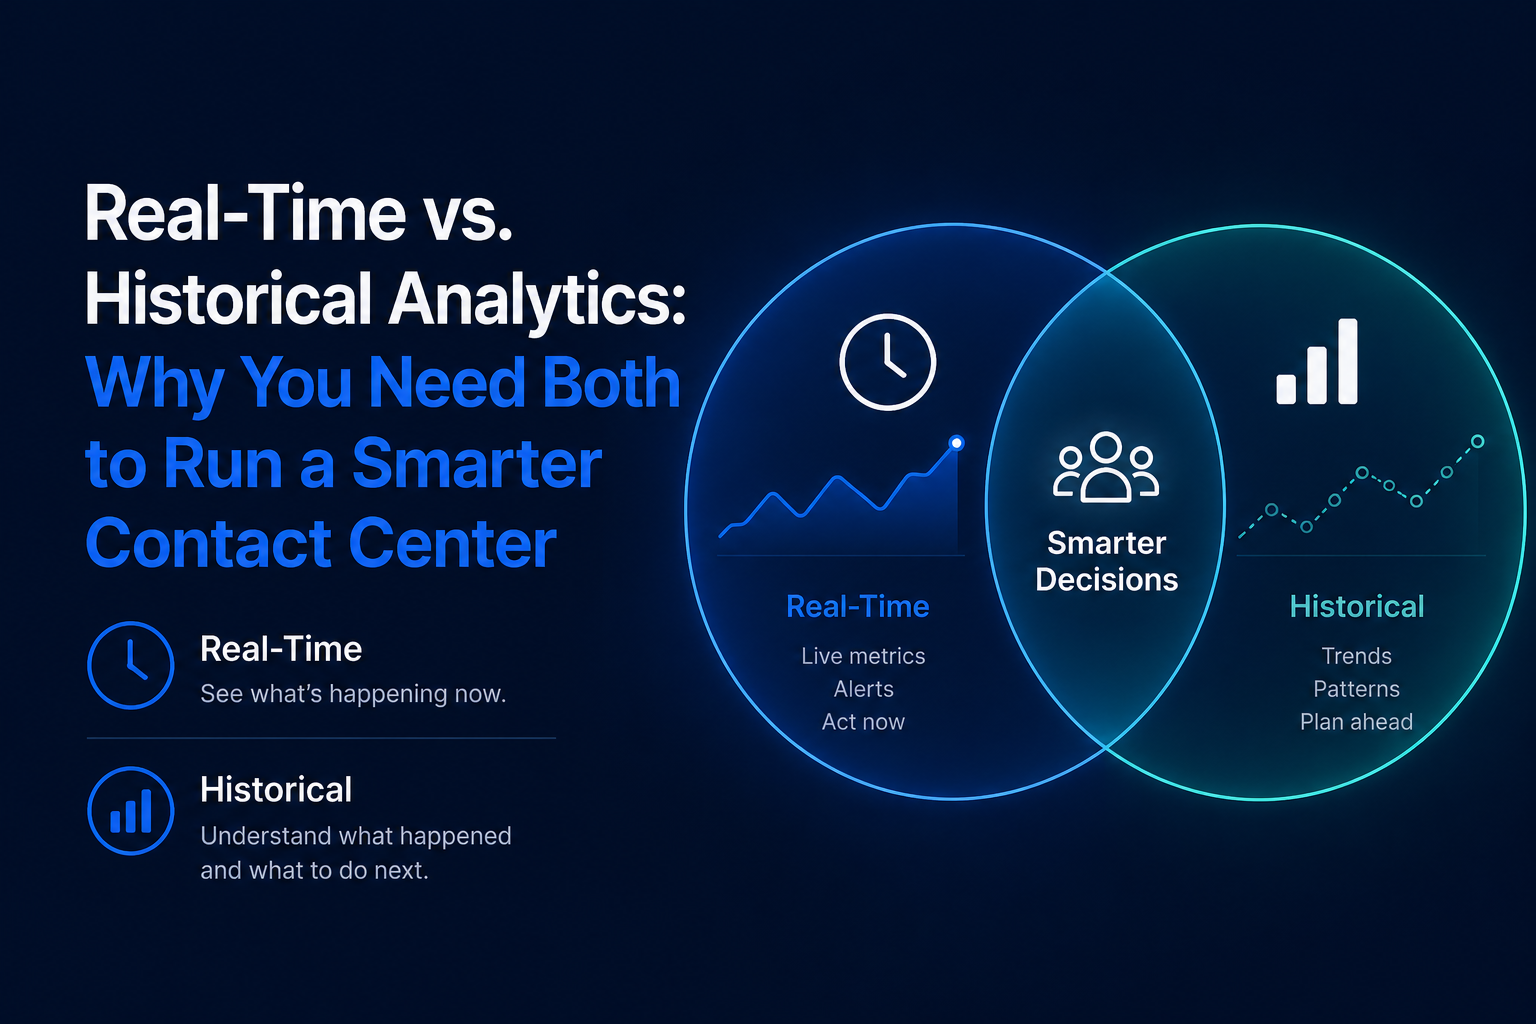
What Are Real-Time Analytics Dashboards?
Real-time analytics dashboards provide a live snapshot of data as it occurs, offering the best way to visualize and use contact center data effectively. Creating customizable dashboards gives you quick access to in-the-moment insights necessary for making strategic decisions that enhance operations and prevent potential customer service issues.
Real-time dashboards serve as a central hub, allowing users to either obtain a high-level view of performance or drill down into specific interaction details. Selecting the right technology is crucial; it should empower users to analyze data easily and make informed decisions without the hassle of navigating complicated, non-customizable interfaces.
4 Ways Real-Time Dashboards Improve Customer Engagement Decision-Making
Real-time dashboards allow you to adapt quickly to changes, optimize operational efficiency, and maintain high customer satisfaction levels by presenting data as it happens. They provide clear and immediate insight into your contact center’s dynamics, enabling a more strategic and responsive management approach.
Four ways real-time dashboards can transform decision-making in your contact center:
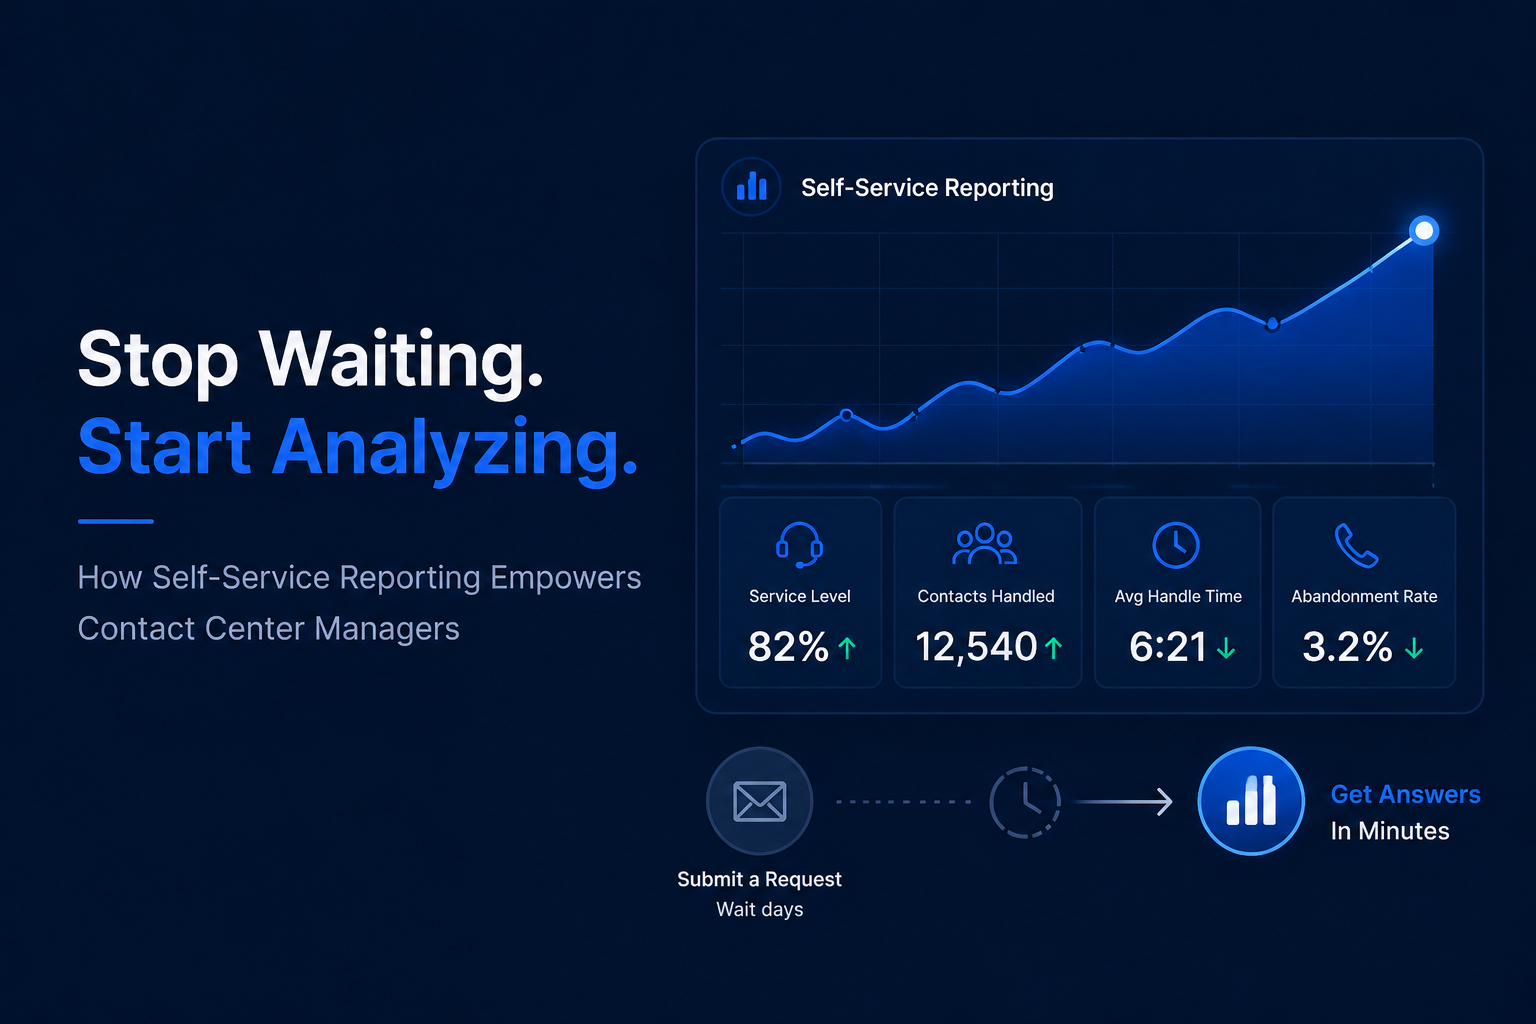
- Enhanced Response Times: Real-time dashboards provide immediate visibility into call volume, wait times, and service levels. This allows managers to quickly identify and address issues as they occur, reducing response times and preventing minor problems from escalating into bigger ones.
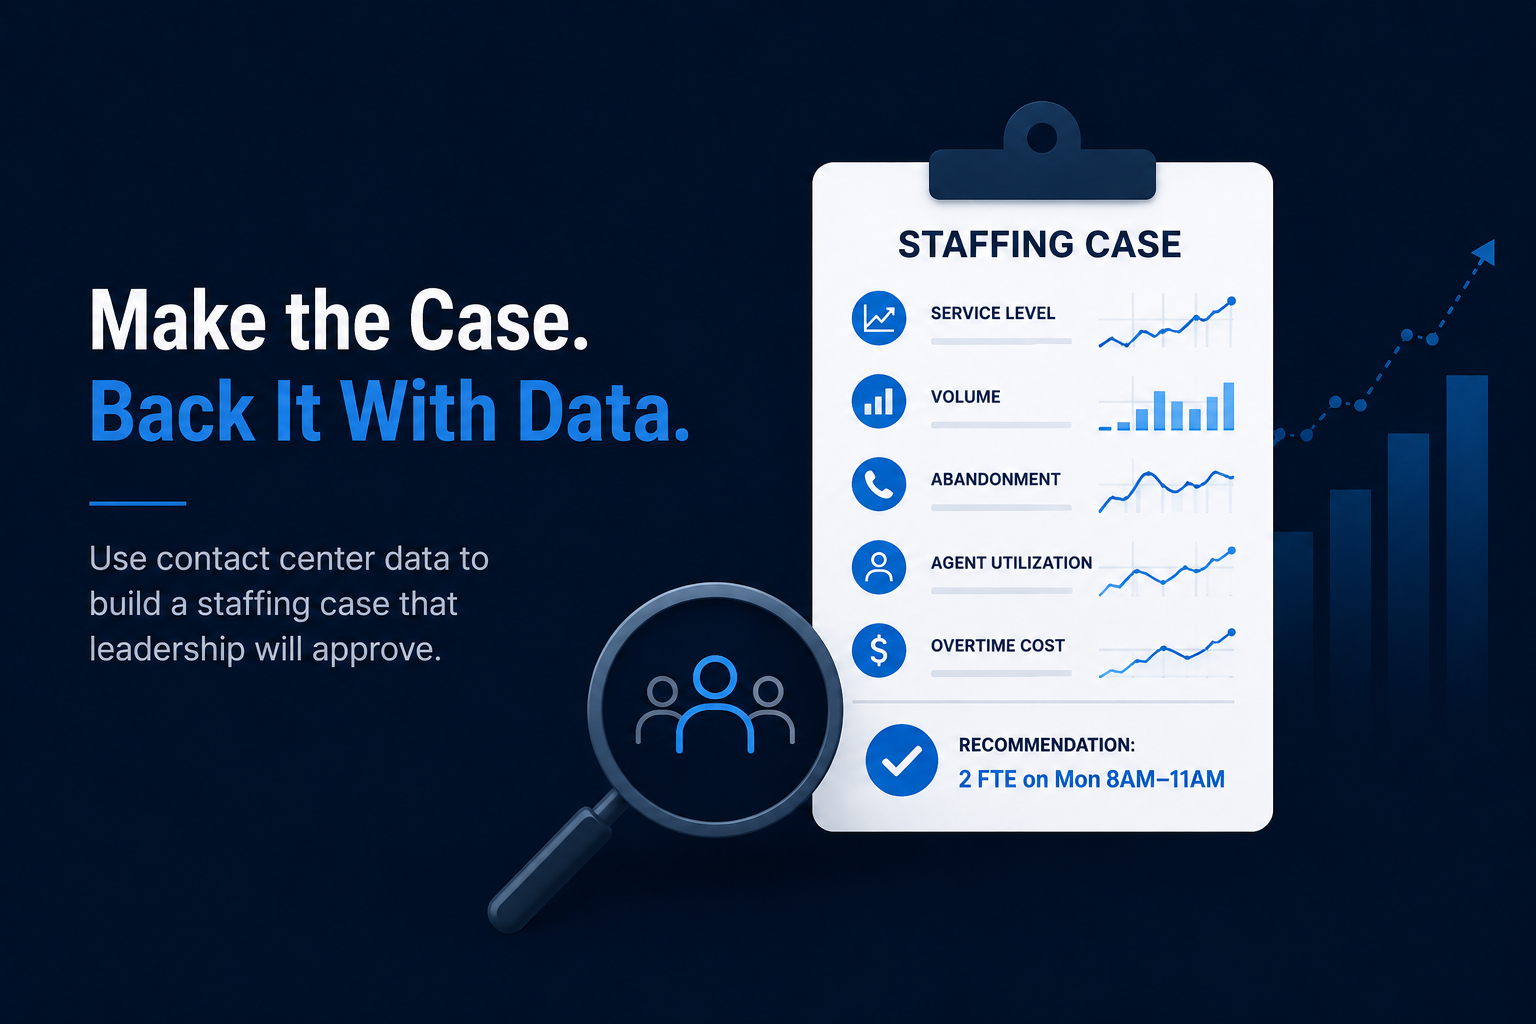
- Improved Resource Allocation: With access to live data, supervisors can make informed decisions about staffing and resource allocation. For example, suppose a dashboard shows a sudden spike in call volume. In that case, additional agents can be deployed instantly to handle the increase, ensuring customer service levels are maintained without unnecessary delays. Proactively balancing workloads leads to reduced wait times for customers, minimal call abandonment rates, and increased agent satisfaction.
- Service Level Alerts and Thresholds: Use your contact center analytics tool to set alerts and thresholds on key metrics, like abandon rates or call wait times. When your chosen metrics hit their threshold, you receive real-time alerts that you can take immediate action on. Real-time data visualization shows these changes instantly, helping you act fast to keep your call center running smoothly.
- Proactive Problem Solving: Real-time dashboards help identify trends and patterns as they develop. This capability enables managers to anticipate potential problems and implement solutions proactively rather than react to them after impacting the customer experience. For instance, if a dashboard indicates a recurring issue at certain times of the day or with specific services, measures can be taken to address these challenges before they affect a more significant segment of customers.
Top Real-Time Metrics to Visualize Contact Center Activity
Choosing the right data to visualize will depend on your specific goals and what you are trying to track. Start by identifying the metrics you track today that provide measurable, reliable, and relevant data.
Here are a few metrics that you can start with:
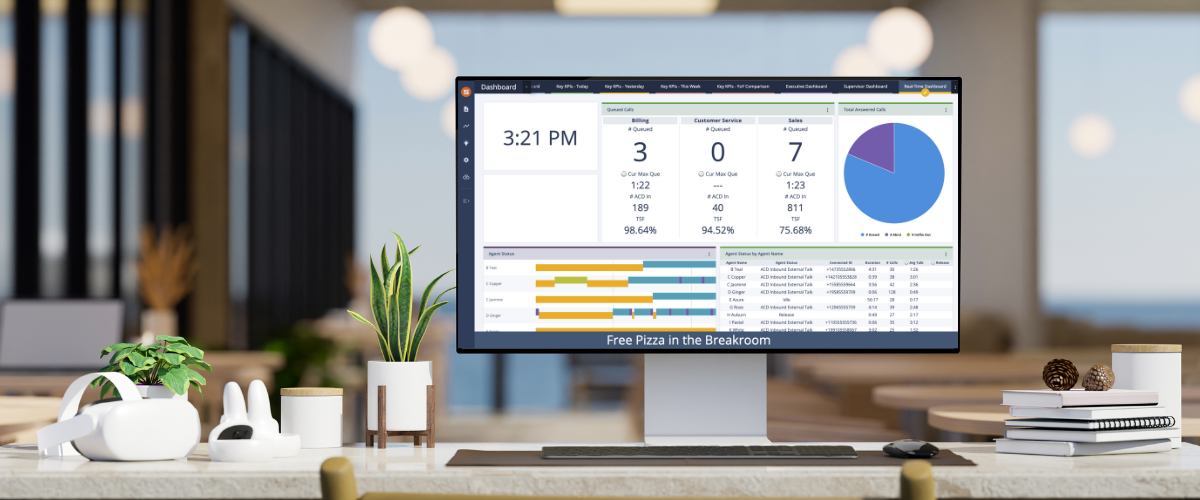
- Queued Calls: The number of callers waiting to interact with an agent.
- Agent Status: Agent status lets you see whether your agents are available, interacting with a caller, or idle.
- Call Count Per Hour: The number of inbound calls your contact center receives hourly.
- Abandonment rate: The percentage of calls disconnected by the caller before reaching an agent.
- Busy Hour: The time of day your contact center has the most engagements and interactions.
- Exit Reason: Pre-implemented codes to tag interactions, identifying why an interaction ended or was interrupted.
Real-Time Dashboards for Proactive Customer Experiences
Visualizing your customer engagement data in real-time significantly enhances contact center experiences, enabling quicker, more strategic decision-making.
Brightmetrics provides valuable insights with our REAL TIME™ dashboards, which are designed to help teams concentrate on crucial performance metrics and enhance operations. Our customizable, user-friendly dashboards can be easily shared to ensure that all contact center teams are well-informed. You can set up alerts and thresholds swiftly to maintain service level standards. As well as quickly distribute wallboard access to foster transparency and keep all contact center teams on the same page.
Discover more of what REAL TIME dashboards can do for your contact center.