“Your call is important to us” has become a common line in the world of call centers and contact centers. But how long are your customers willing to wait for a response from your customer service agent? We can predict the sentiment with the key performance indicator, known as Average Wait Time (AWT).
Understanding Average Wait Time for Call Centers
In the call center or contact center environment, Average Wait Time (AWT), also referred to as Average Speed of Answer (ASA), refers to the average time an inbound call remains in the queue until an agent answers it. AWT might include the average waiting time for callbacks within some IVR systems.
In a popular study conducted in 2014, American Express discovered that callers willingly waited for an average of 13 minutes in resolving an issue. Three years later, a similarly designed survey by Arise found that two-thirds of customers would accept hold times of less than two minutes, while 13% rejected hold times altogether. The constantly evolving customer experience requires call center leaders to identify KPIs that align with their business goals. The strategies should include methods of identifying trends and applying them to make smarter decisions. For instance, reducing a key metric such as Average Wait Time can drastically improve caller experiences.
Why Is Call Waiting Time Important?
Roughly 34% of customers hang up due to delayed responses and never call back. This means you are likely missing out on the opportunity to connect with 34% of customers with the potential for upselling, product upgrading, or beneficial education. These missed opportunities present a challenge when it comes to customer retention and churn.
Customer services trends clearly suggest a relationship between customer satisfaction and organizations that promptly handle customer service requests. In the world of chatbots, callbacks, social media, and sophisticated IVR systems, modern customer expectations rely on instant solutions.
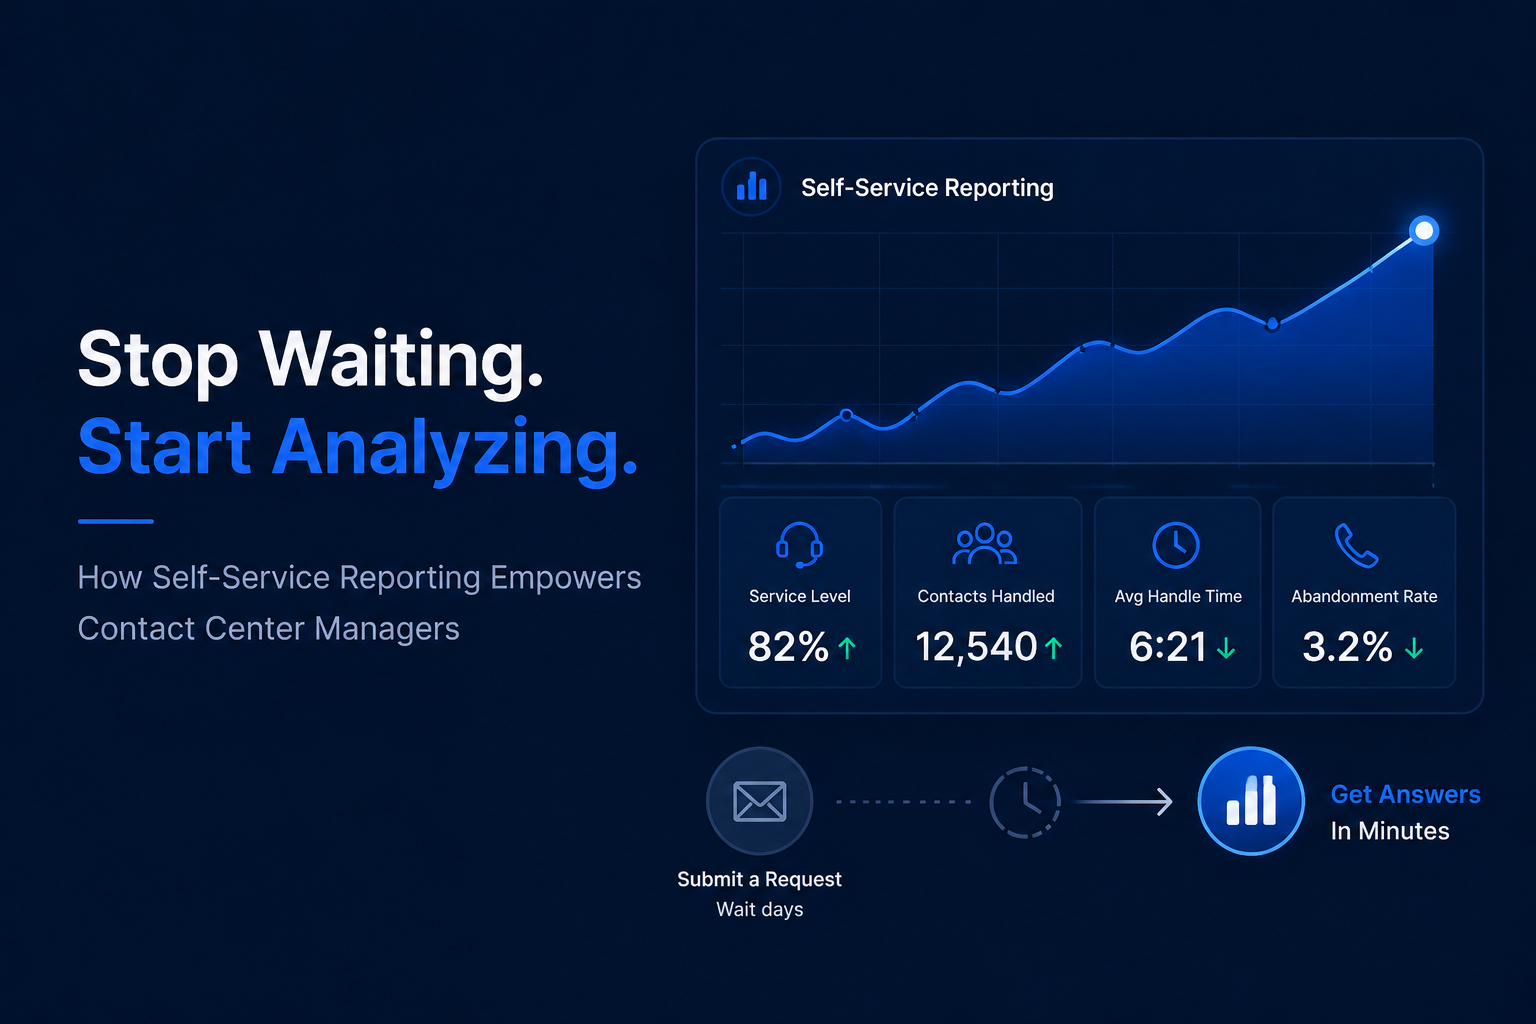
Gradually customer support is transforming in front of us into a focus on a mix of metrics: the Average Speed of Answer (ASA), the Average Handle Time (AHT), and the Average Abandoned Rate (ABA). Each of these individually is an important call center performance metric but together they illustrate the experience of interaction with your company.
How To Calculate Average Wait Time
You can acquire AWT by adding the total wait times for all answered calls and dividing it by the number of answered calls.Remember to exclude abandoned calls where the caller hangs up before reaching an agent.
What is the Call Center Wait Time Industry Standard?
For years the 80/20 rule, or 80% of calls answered within 20 seconds, has remained an industry service level standard. However, these standards may differ slightly by industry. Utilizing customer satisfaction scores can help determine the best service level agreement for optimal AWT scores relative to your business.
Average Wait Time and the Customer Experience
Average wait time in a call center may vary across multiple factors including the complexity of the query, day, or call volume. You might experience instances when callers receive an immediate response after a seamless IVR routing experience and gain complete satisfaction with the outcome of their call. However, the same callers may experience an entirely different experience during a later call.
Customers hoping to reach an agent may be waiting for an excessive amount of time or getting transferred from department to department without a resolution. A single dissatisfactory caller interaction can quickly undo past confidences in your organization. As such, many organizations and team leaders constantly seek to manage and mitigate contact center interactions.
3 Strategies for Reducing the Average Wait Time in Your Call Center
Contact center managers who are looking to reduce average call wait times and improve efficiencies have several strategies to consider:
1. Plan Ahead
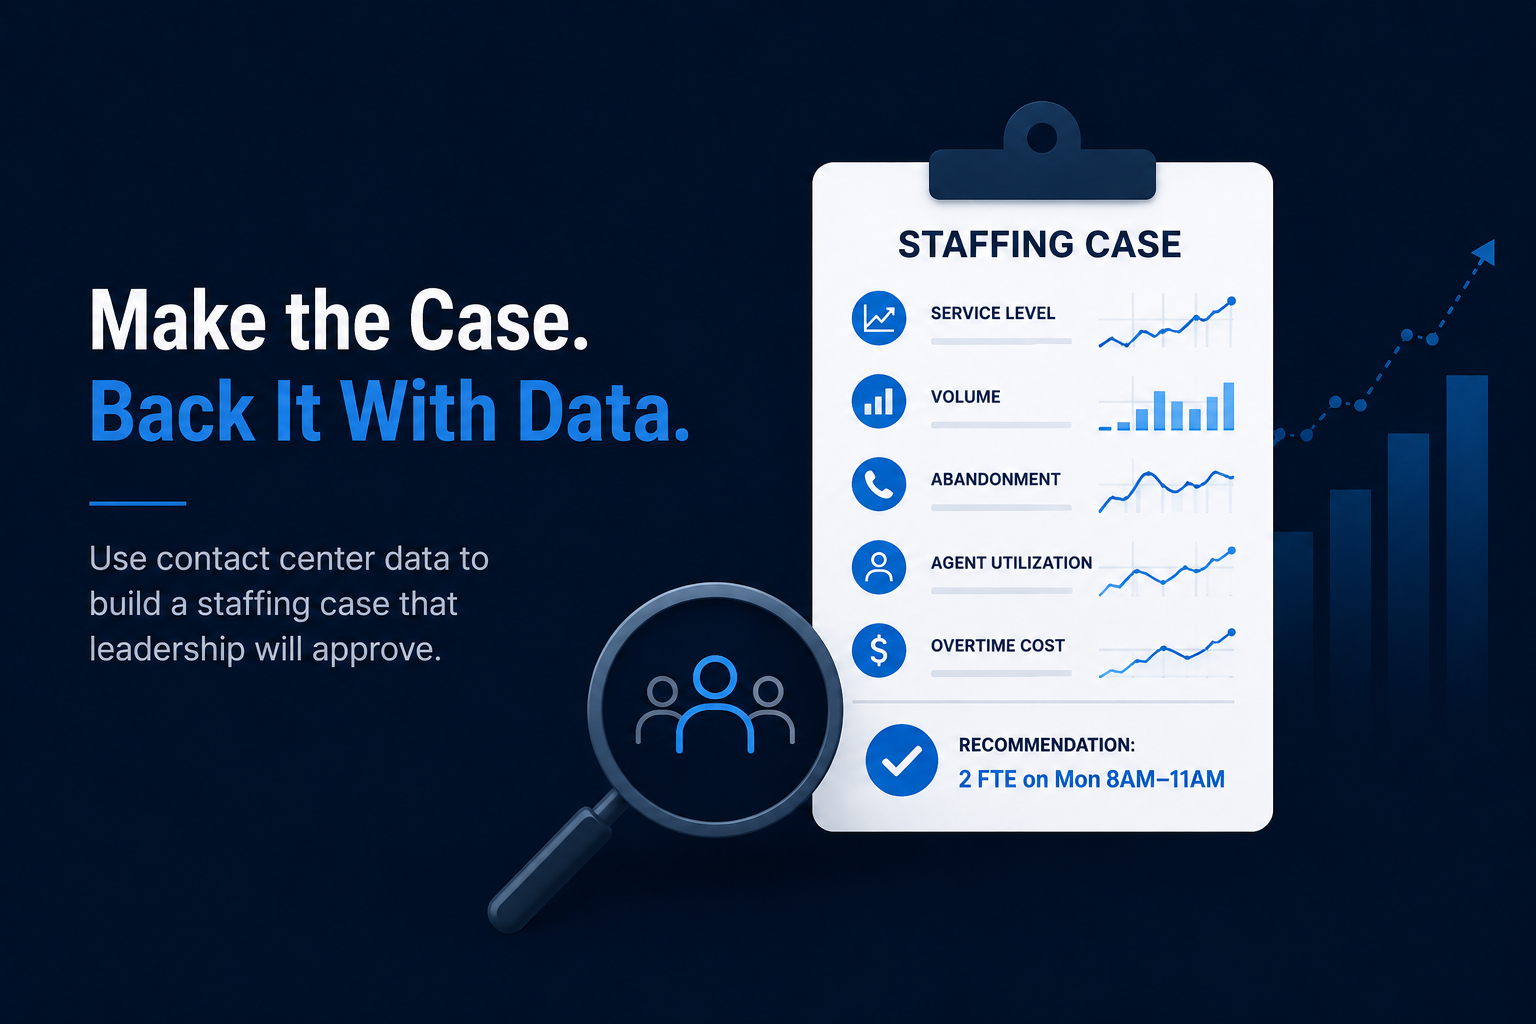
Consider pulling historical data and focusing on peak call volume trends and anomalies for systematic analysis. Tools like Brightmetrics™ can help create customized reports that highlight pivotal trends and patterns that drive smart staffing decisions and optimized procedures.
You may use dashboards to monitor agent status, call volume, and busy hours. Making intelligent business decisions starts with having access to the required information. Planning ahead using the insights obtained with your analytics tools can help optimize processes that include:
- Proper staffing and scheduling
- Making hiring, training, and coaching decisions
- Reviewing pain points and their impact on other measured KPIs throughout the customer journey
2. Fine-Tune Your Contact Center Call Queue
Empowering your call center agents with the right technology makes a big difference in your customer experience. With Brightmetrics REAL TIME Analytics™ for Genesys and Mitel, we help your agents track the exact number of calls in a queue at any moment in time. Our solutions provide the information needed to monitor calls for maximum impact. For instance, you may reduce call times for after-work hours as a key strategy for reducing the average waiting time.
Another way to optimize queues involves siloing your agents based on their metrics. You may place agents who consistently handle their calls effectively and efficiently into specialized queues during pivotal times for handling more complex issues. Similarly, you might position agents who struggle with handling time (while having excellent CSAT scores) for less complex issues. Real-time analytics can also show you teams already optimized to their fullest extent. If the average wait time is still an issue, it might be time to call in extra agents.
3. Consider the Big Picture
Incorporating historical and real-time analytics into your business can significantly reduce average wait times. Gathering actionable insights from these places can greatly guide strategy and execution for organizations. Yet, sometimes, the “answer” does not lie in the data output. Going easy on your service level standards might hold the key to improved AWT results.
We mentioned the industry standards lean against the 80/20 rule and how abandoned calls have detrimental results. Generally, your call center performs well if you have answered 80% of calls within 60 seconds with stellar NPS or CSat scores. Those extra seconds of wait time have a negligible effect on your overall customer experience. You may choose to exercise some flexibility with “the industry standard” if your customers remain satisfied with your solutions.
Keeping your eyes on the big picture can help you figure out what you actually prioritize for your customers. So this “tip” to reduce average wait times is cautioning you to keep it all in balance with the quality management of the customer experience you provide. Ultimately, customers seek pleasant positive experiences with friendly and knowledgeable staff. Build your own standards into your service levels and your team will come to know the approach that works best for your customers.