TL;DR: Call center data is invaluable, but manual management is overwhelming. Advanced software is essential. The article explains the differences between reporting and analytics, where reporting organizes data without insights, while analytics delves deep to provide valuable insights for better business decisions.
Data is here to stay, and your call center’s engagement data is a treasure trove. Handling it manually has become an overwhelming task for call center managers, making advanced software and tools a necessity.
Understanding the distinctions between reporting and analytics is the key to unleashing the full potential of this engagement data. This article will help you navigate this data-driven landscape, offering insights into the key differences between reporting and analytics and how they can elevate your call center operations to new heights.
What Is the Difference Between Reporting and Analytics?
Both reporting and analytics tools convey important information to help make better business decisions. How they assist in decision-making is where the two types of data contrast.
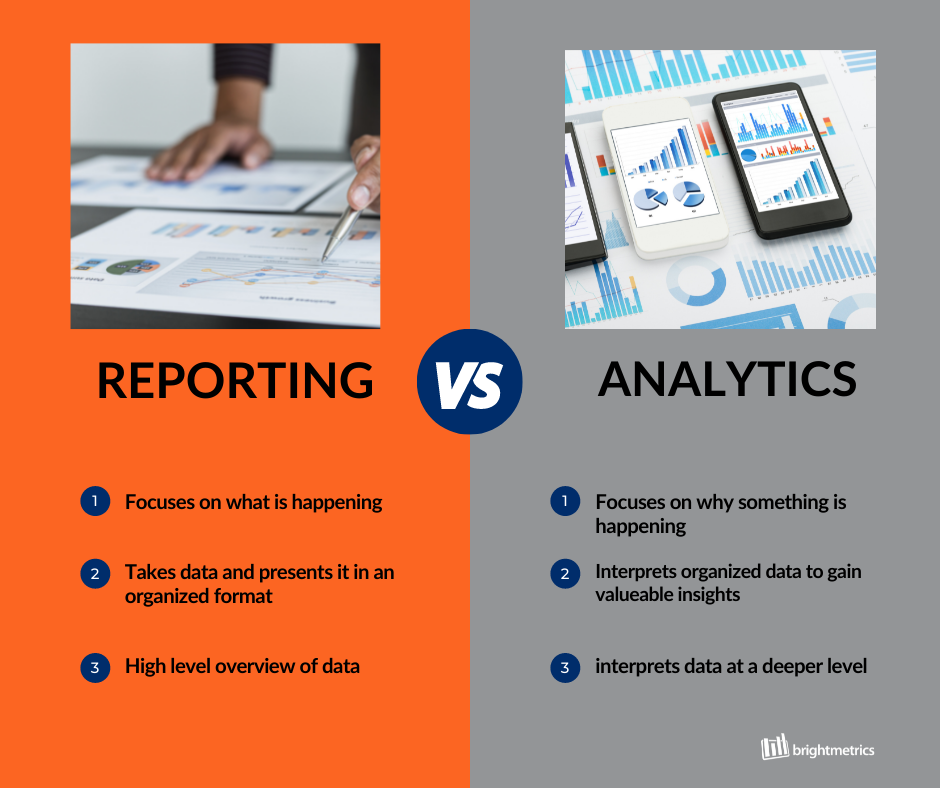
Reporting involves organizing and presenting existing data in a user-friendly format without offering judgments or insights. It extracts and combines data from various sources in a precise and defined manner. These reports answer the question, “What is happening?” in day-to-day operations by summarizing historical data through tables, charts, and graphs. They provide a clear snapshot of key performance indicators (KPIs) and operational metrics, aiding managers in tracking trends and assessing past performance. Reporting tools are indispensable for monitoring operations and identifying areas for improvement.
Analytics involve diving deep into data to discover insights that inform business decisions. It’s all about understanding the “why” behind what’s happening in an organization. Analytics tools use historical data, algorithms, and models to identify patterns and causes, going beyond the “what” to answer the “why” and “how.” This enables proactive decision-making, predicting future trends and outcomes, optimizing processes, enhancing customer experiences, and strategizing for the long term. Analytics transforms data into actionable intelligence, driving informed, forward-looking decisions.
Reporting vs Analytics: 3 Core Differences
In comparing reporting and analytics, the key distinctions come down to three core factors.
1. Purpose
- Reports are designed to convert data into clear, organized information.
- Analytics seek to derive insights that drive improved business decisions.
2. Methods
- Reporting involves actions like organizing, formatting, configuring, summarizing, and consolidating.
- Analytics uses methods like investigation, deep dives, questioning, examination, interpretation, comparison, and confirmation.
- Reports follow a “push” approach, where the system delivers reports to users such as managers, employees, or consultants.
- In contrast, analytics follow a “pull” approach, as tools extract answers to various business questions. For call center analytics, this can mean predictive insights about the future or prescriptive guidance on optimizing the next steps.
3. Value
- Both reporting and analytics hold significant value for your organization. Reporting deals with the current state, describing “what is.”
- Analytics, in contrast, focuses on possibilities and “what could be.”
To align your strategy with growth goals, drawing meaningful insights from your call center data is crucial. Without effective reporting and analytics, organizations may struggle to obtain, organize, or strategically utilize their data, potentially hindering their progress and customer experience. In fact, 72% of call centers reported that implementing robust reporting and analytics tools resulted in improved customer satisfaction and a 15% increase in operational efficiency.
An Example of Data Reporting and Data Analytics in the Call Center
What does this look like in action?
Example: Reporting

This report on a basic call queue may seem limited in scope, but it does reveal that there were 111 abandoned calls in the past week. While this information is a small piece of the puzzle, it’s crucial to consider that key peripheral data is missing, which can make all the difference.

In this next report, we know that there were 111 abandoned calls and the average time a caller waited was almost two minutes before deciding to hang up. This is also a simple report, but that’s how it’s intended to be.
A report brings attention to the key performance indicators (KPIs) that are important to you and your team. This is where analytics play a key role. Analytics bring context to those reports.
Example: Adding Analytics
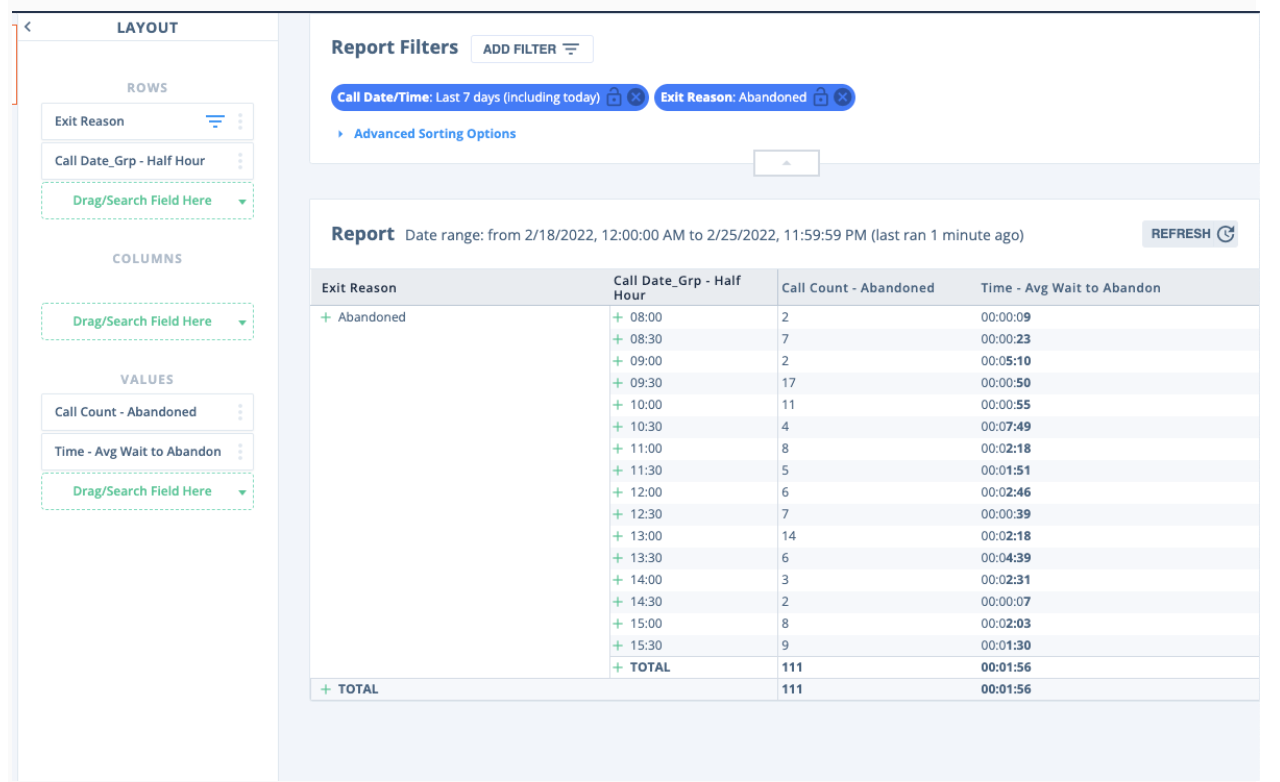
One way to dive deeper and analyze the data in this report is to look at hour or half-hour intervals. For example, you can see that half-hour intervals have been added here. This clearly shows that the bulk of the abandoned calls occurs from 9:30-10:30 am or 1:00-1:30 pm.
From there, you could go deeper by looking at call volumes—were there just a lot more calls during that time? You could also consider staffing levels—are these common break times for the agents? Understanding the cause of the issue helps call center managers understand where they can make adjustments.
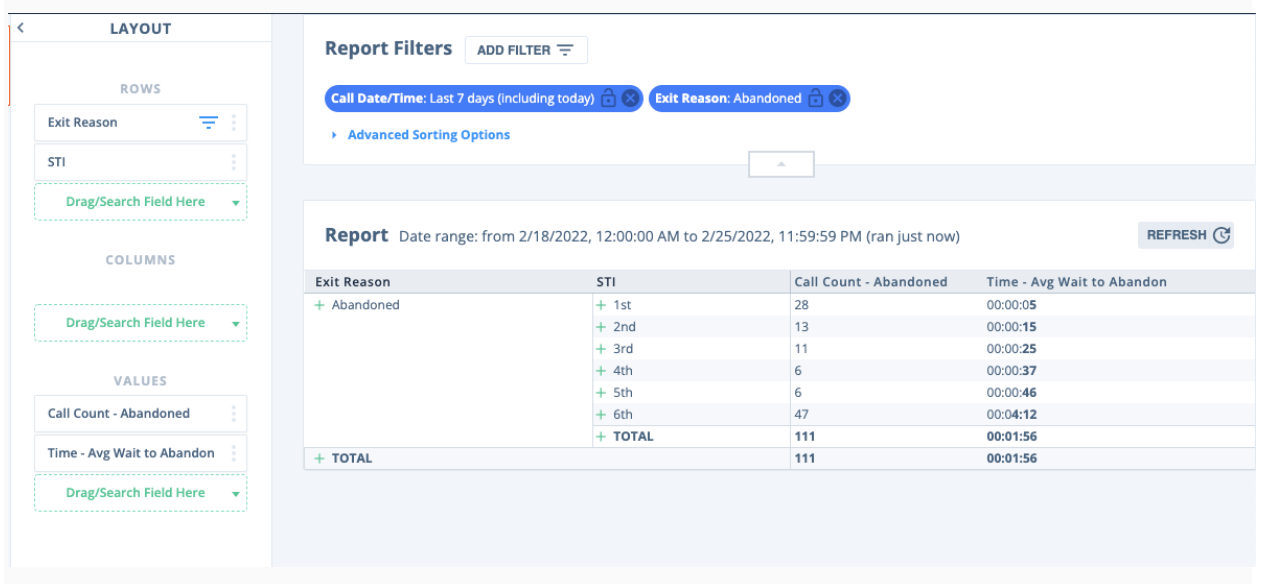
You could also examine Service Time Intervals (STI) to understand the distribution of how long customers are waiting before hanging up.
By adding this factor to the report, you can see that 28 callers abandoned their call at an average of 5 seconds or less. There isn’t much that can be done about this, and those customers likely aren’t particularly frustrated. Maybe they just got another call and decided to call back later.
But a large portion of the callers, 47, waited for an average of 4 minutes and 12 seconds. That’s where you want to plug holes as quickly as possible. How can you reduce the average wait time by a minute or two?
This is where the two examples we’ve depicted here begin to intersect. You could examine these aspects for each hour of the day or add more data to paint a clearer picture. With a nimble analytics tool, you can examine all the pertinent information until you fully understand what’s occurring and how to change it going forward.
The ability to manipulate the data on reports in real time for better business decisions makes analytics so special. Of course, getting insights from your call center data is possible by building out multiple versions of your own static reports, but it’s difficult to determine which metrics to pull into a perspective that will be important.
By looking at the example, you may do nothing about the callers that held for under 5 seconds. However, if you decide that 47 abandoned calls after an average of over four minutes is unacceptable, you can address the issue directly.
Analytics and Reporting Tools for Business Call Centers
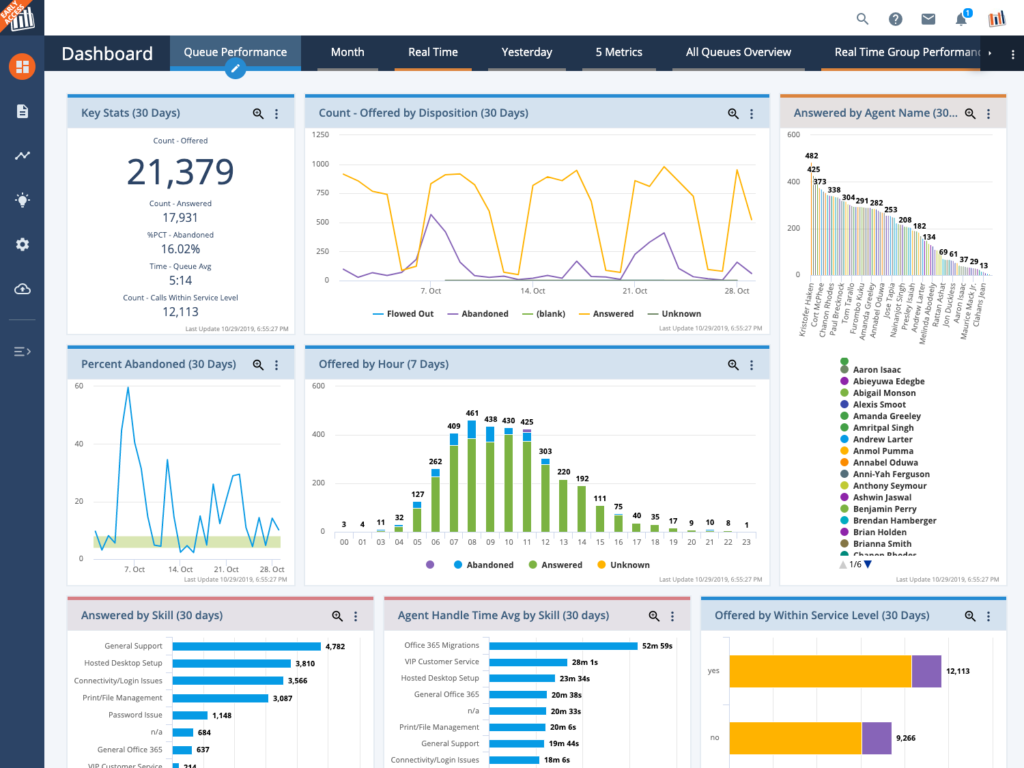
While there’s a wealth of data visualization and analytics software available for call centers, few offer comprehensive reporting functionality and customizable options. Given the large amount of customer data call centers accumulate, effective management requires a combination of detailed reporting services and powerful call center analytics to ensure top-notch customer experiences. The solution lies in a complete analytics suite that provides both tailored dashboards and reporting capabilities for organizations.
At Brightmetrics, our mission is to empower teams to extract maximum value from their UC and contact center data. Our analytics and reporting platforms equip teams with invaluable insights into their contact center’s performance, allowing for analysis based on their own key performance indicators and metrics.
Our user-friendly summary dashboards simplify the process, and our reporting tools are highly adaptable to suit your business requirements. With our intuitive drag-and-drop features, all members of your management team can effortlessly create and schedule reports. Additionally, they have the flexibility to craft public dashboards that ensure your team stays informed, regardless of their location. Our analytics service empowers users to decipher both high-level trends and nuanced details that directly impact customer experiences and agent performance.
Key Takeaways On Analytics vs Reporting
It’s not a question of analytics versus reporting – successful call centers need both. Reporting entails using advanced tools with intricate details tailored to your organization and clients. Your analytics platforms must efficiently handle large data volumes and derive valuable insights from various report types.
The quality of your analytics directly impacts how efficiently your reporting can provide game-changing insights. This might translate into improved staff rotation, better training, or a restructuring of call workflows, even agent reallocation based on skill sets.
Reach out to Brightmetrics to explore analytics that align your call or contact center strategy with your business goals, fostering purposeful decision-making. By creating more accessible and practical reports, you can gain deeper insights from your data, propelling your organization towards success.


