TL;DR: People often think data reporting and data analytics are one and the same. In reality, reporting is the sorting and organization of data, while analytics derive insights from that data and often influence business decisions. Three key differences to take note of between reporting and analytics are purpose, methods, and value. Call centers gather an extensive amount of customer data over time, therefore management teams require both powerful analytics and detailed reporting in order to deliver excellent customer experiences.
Data is here to stay. While your call center data may only be a drop in the ocean, it’s still an enormous amount of data to handle and of vital importance to your operation. Collating data about your agents and customers is a mammoth task that managers can’t handle manually anymore. Nowadays, you must add to that the transformation of business-critical data into meaningful reports and the analysis of those reports. All this requires advanced software from a trusted provider.
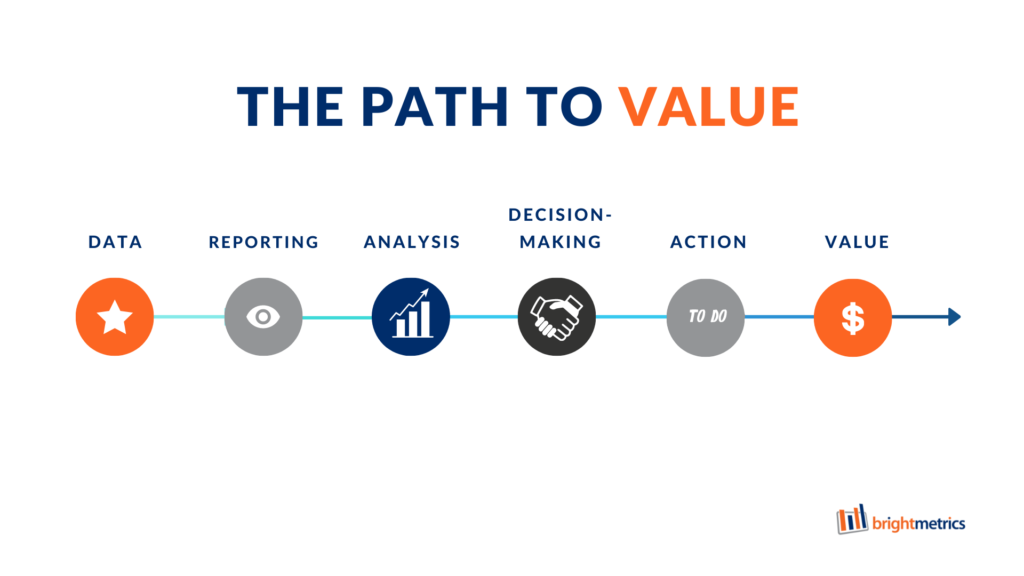
Businesses that understand the value that their data holds can naturally move ahead of competitors. A better understanding of data through reporting and analysis helps with decision-making and action. Over time, this leads to an increase in the value of your organization and enhanced performance within your outfit.
One obstacle to getting an effective reporting analytics platform is a full understanding of the differences between reporting and analytics. Clarifying your understanding of these terms can boost the effectiveness of your call center.
What Is the Difference Between Reporting and Analytics?
Regarding call center data management, “reporting” and “analytics” aren’t as interchangeable as some seem to think. Understanding the differences better can mean a great deal to your company’s bottom line.
Reporting is intrinsically linked to data analytics. You can’t really have effective analytics without comprehensive reporting. You should at least have complete data collation from business-specific sources. However, data analytics goes much further than reporting.
What Are the Definitions of Reporting and Analytics?
Both reporting and analytics tools convey important information to help make better business decisions. How they assist in decision-making is where the two types of data contrast.
Reporting: taking existing information and organizing it in a way that is user-friendly and digestible. Reports offer no judgment or insight. They simply present the data in a recognizable or usable format. Data reporting often extracts data from different sources and combines those sources in a concise manner. Reporting should always be accurate, precise, specified, and defined. Your call center reports should answer the question, “What is happening?” in day-to-day business operations.
Analytics: drilling down into data to look for insights that will inform business decisions by injecting business expertise into the interpretation of the data. Data analytics focuses on “why” something is happening within an organization. Analytics by nature are meant to assist in determining a course of action, predictions, or recommendations.
Reporting vs Analytics: 3 Key Differences
While there are multiple differences in reporting vs. analytics, the core of the issue comes down to these three main points.
1. Purpose
The purpose of reports is to take data and organize it into clear information. Analytics aims to take that data and provide insights that drive better business decisions.
2. Methods
When discussing reports or reporting, you may use language such as organizing, formatting, building, configuring, consolidating, or summarizing.Analytics employs words and phrases like investigating, performing a “deep dive,” questioning, examining, interpreting, comparing, and confirming.
Reports follow what is commonly referred to as a “push approach.” This simply means that whatever system call centers use pushes reports to the relevant user. These users could be managers, employees, or consultants. Recipients could be anyone that needs to access the data within the report.
If reports “push,” then it’s no surprise that, by contrast, analytics follow a “pull” approach. Tools complete data analysis to “pull” out the answers to a variety of business-based questions. In the case of call center analytics, the deliverables could be predictive analytics. These are answers about what is going to happen in the future. You may also require prescriptive analytics that examine ways to optimize the next steps.
3. Value
Ideally, your business processes should help your organization grow, move forward, or increase your value in your respective marketplace. It’s important to understand that, with this in mind, both reporting and analytics are highly valuable to your business model. However, reporting is about what is, and analysis is about what could be.
To keep your strategy aligned with your growth goals, you need to be able to draw meaningful insights from many aspects of your call center data. Without effective reporting analytics solutions, some organizations struggle with how to obtain and organize their data. Other companies fail to use their data strategically.

An Example of Data Reporting and Data Analytics in the Call Center
So what does this look like in action?
Example: Reporting

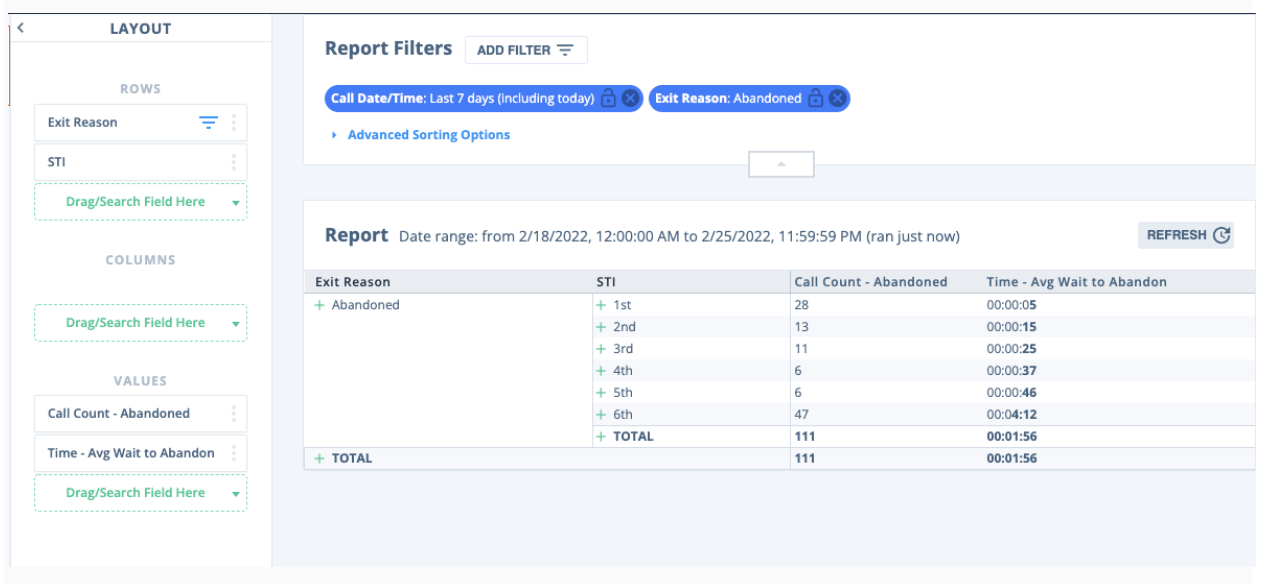
This report around a simple call queue is not much of a report by itself, but you do see that there were 111 abandoned calls over the last week. This report gives you a tiny piece of information, but you’re missing some key peripheral data that makes all the difference.
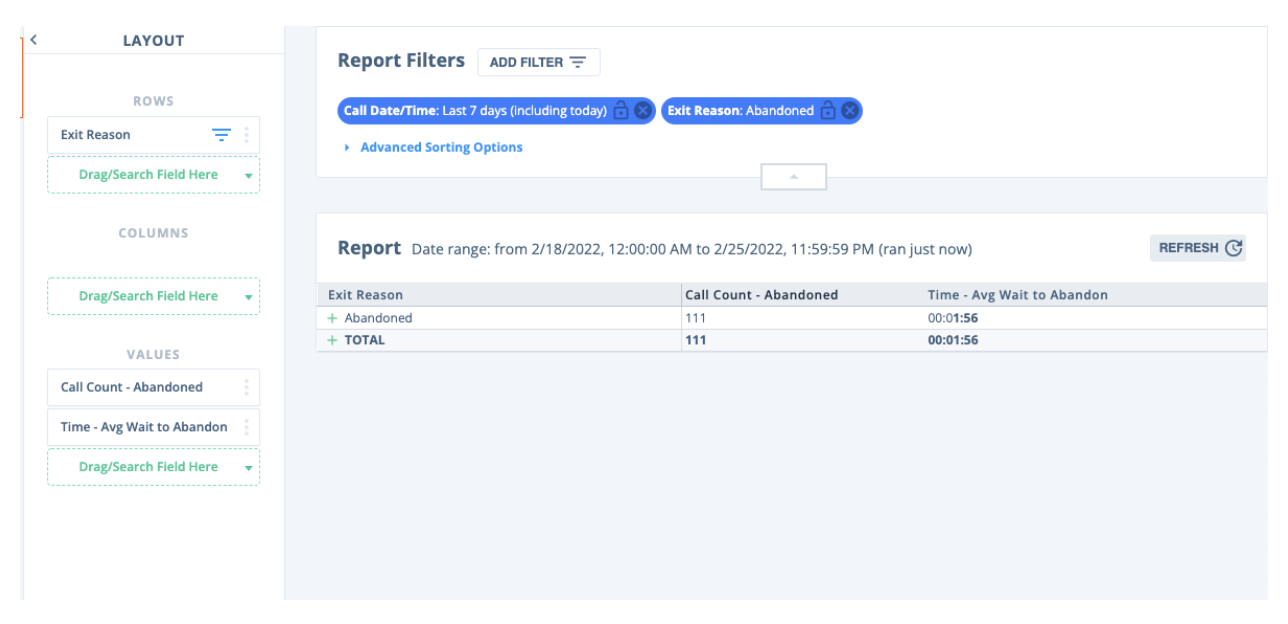
Now in this next report, we know that there were 111 abandoned calls and the average time a caller waited was almost two minutes before deciding to hang up. This is also a simple report, but that’s how it’s intended to be. A report brings attention to the key performance indicators (KPIs) that are important to you and your team. This is where analytics play a key role. Analytics bring context to those reports.
Example: Adding Analytics
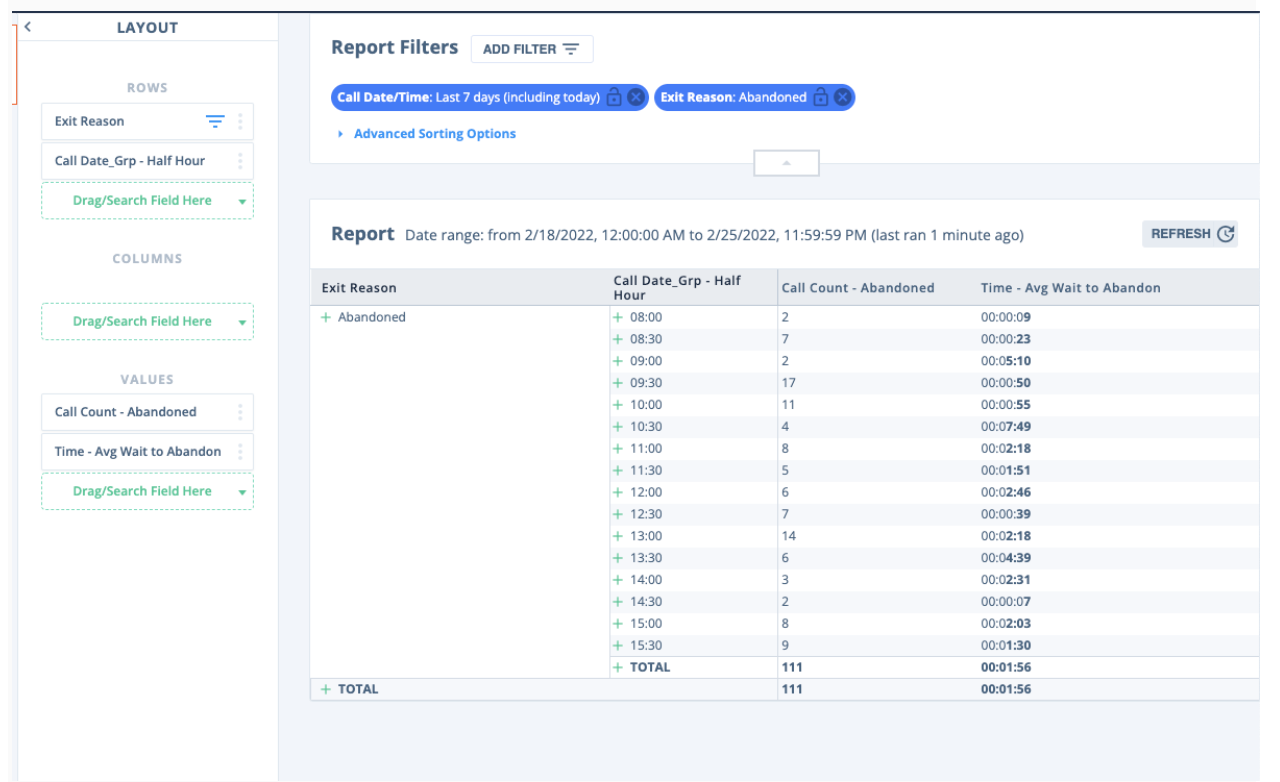
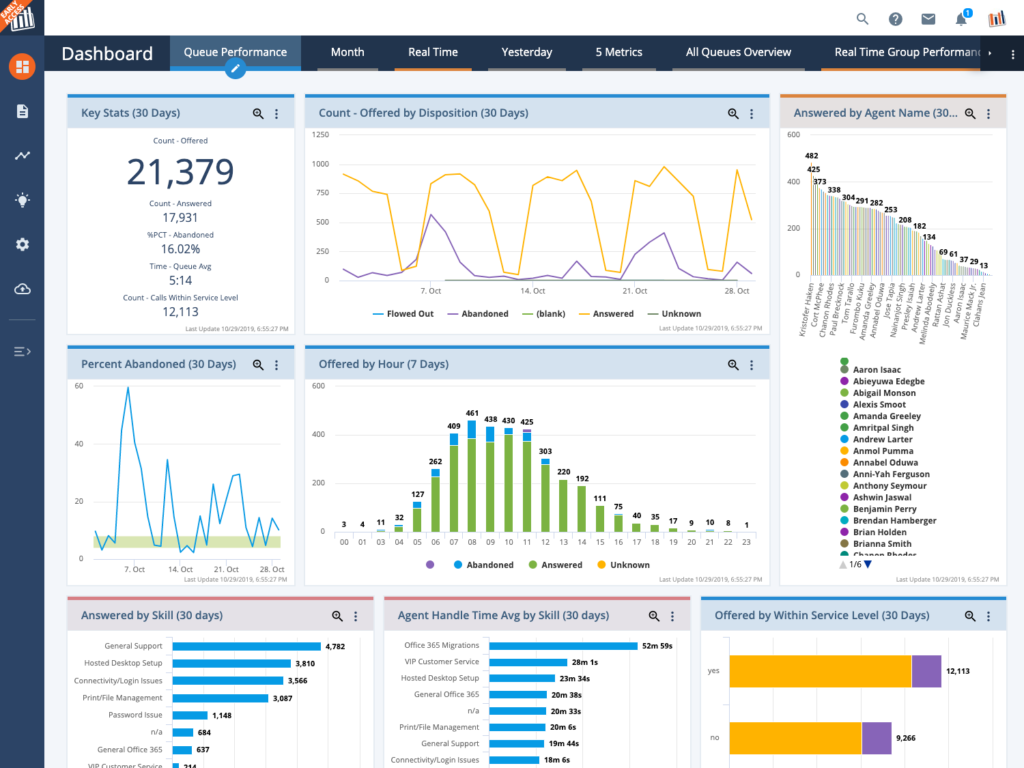
One way to dive deeper and analyze the data in this report is to look at hour or half-hour intervals. For example, you can see that half-hour intervals have been added here. This clearly shows that the bulk of the abandoned calls occurs from 9:30-10:30 am or 1:00-1:30 pm. That’s interesting.
From there, you could go deeper by looking at call volumes—were there just a lot more calls during that time? You could also consider staffing levels—are these common break times for the agents? Understanding the cause of the issue helps call center managers understand where they can make adjustments.
You could also examine Service Time Intervals (STI) to understand the distribution of how long customers are waiting before hanging up.
By adding this factor to the report, you can see that 28 callers abandoned their call at an average of 5 seconds or less. There’s not much that can be done about this, and those customers likely aren’t frustrated. Maybe they just got another call and decided to call back later.But a large portion of the callers, 47, waited for an average of 4 minutes and 12 seconds. That’s where you want to plug holes as quickly as possible. How can you get that average wait time down by a minute or two?
This is where the two examples we’ve depicted here start to play together. You could examine these aspects for each hour of the day or add more data to paint a clearer picture. With a nimble analytics tool, you can examine all the pertinent information until you fully understand what’s occurring and how to change it going forward.
The ability to manipulate the data on reports in real time for better business decisions is what makes analytics so special. Of course, getting insights from your call center data is possible by building out multiple versions of your own static reports, but it can be difficult to determine which metrics to pull into a perspective that will be important at any given time.
By looking at the example, you may not be able to do anything about the callers that held for under 5 seconds. However, if you decide that 47 abandoned calls after an average of over four minutes is unacceptable, you can address the issue directly.
Analytics and Reporting Tools for Business Contact Centers
While a wide variety of data visualization and analytics software is available for call centers, few include robust reporting functionality and customization options. Due to the extensive amount of customer data a call center may gather over time, management teams require both detailed reporting services and powerful call center analytics platforms in order to deliver excellent customer experiences. The answer is a full analytics suite that provides bespoke dashboards and reporting for organizations.
At Brightmetrics™, our mission is to help teams get more from their UC and contact center data. Our analytics and reporting platforms enable teams to gain critical insights into the performance of their contact center by analyzing data based on their own key performance indicators and metrics. Our summary dashboards are easy to use, and our reporting tools can be easily customized to fit your business needs. Everyone within your management or strategy team can use our intuitive drag-and-drop capabilities to build and schedule reports. They can also create public dashboards to keep your team up to speed no matter where they are located. Our business intelligence software enables users to see the high-level trends and finer details that impact customer experiences and agent performance.
Get started with a free trial and harness the power of your data to make intelligent business decisions.
Key Takeaways On Analytics vs Reporting
It’s not a case of analytics vs. reporting. Successful call centers simply cannot have one without the other. Reporting means employing sophisticated tools with intensely detailed nuances that reflect the needs of your organization and your customers or clients. Your analytics platforms need to be able to handle large volumes of data and provide meaningful insights from multiple types of reports.Reporting is vital because carefully collated and organized data is easier to visualize. Visualization of data is important because this transforms that data into actionable reports that anyone in the business can quickly and easily comprehend. You don’t need an interpreter for the data because the visuals interpret it for you.
The better your reporting is, the faster your analytics tools can provide insights that genuinely make a difference. This might mean better staff rotation, improved training, or a change to the general call structure. It could even mean moving call center agents to different queues based on their skill set.
Talk to Brightmetrics about analytics that help you align your contact center strategy with your business goals and be intentional with your decision-making. Create reports that are more accessible and useful, and gain better insights from your data that drive your organization’s success. Sign up for your free trial with Brightmetrics today and unlock the full potential of your center.